

Watershed Information Tools
WIT
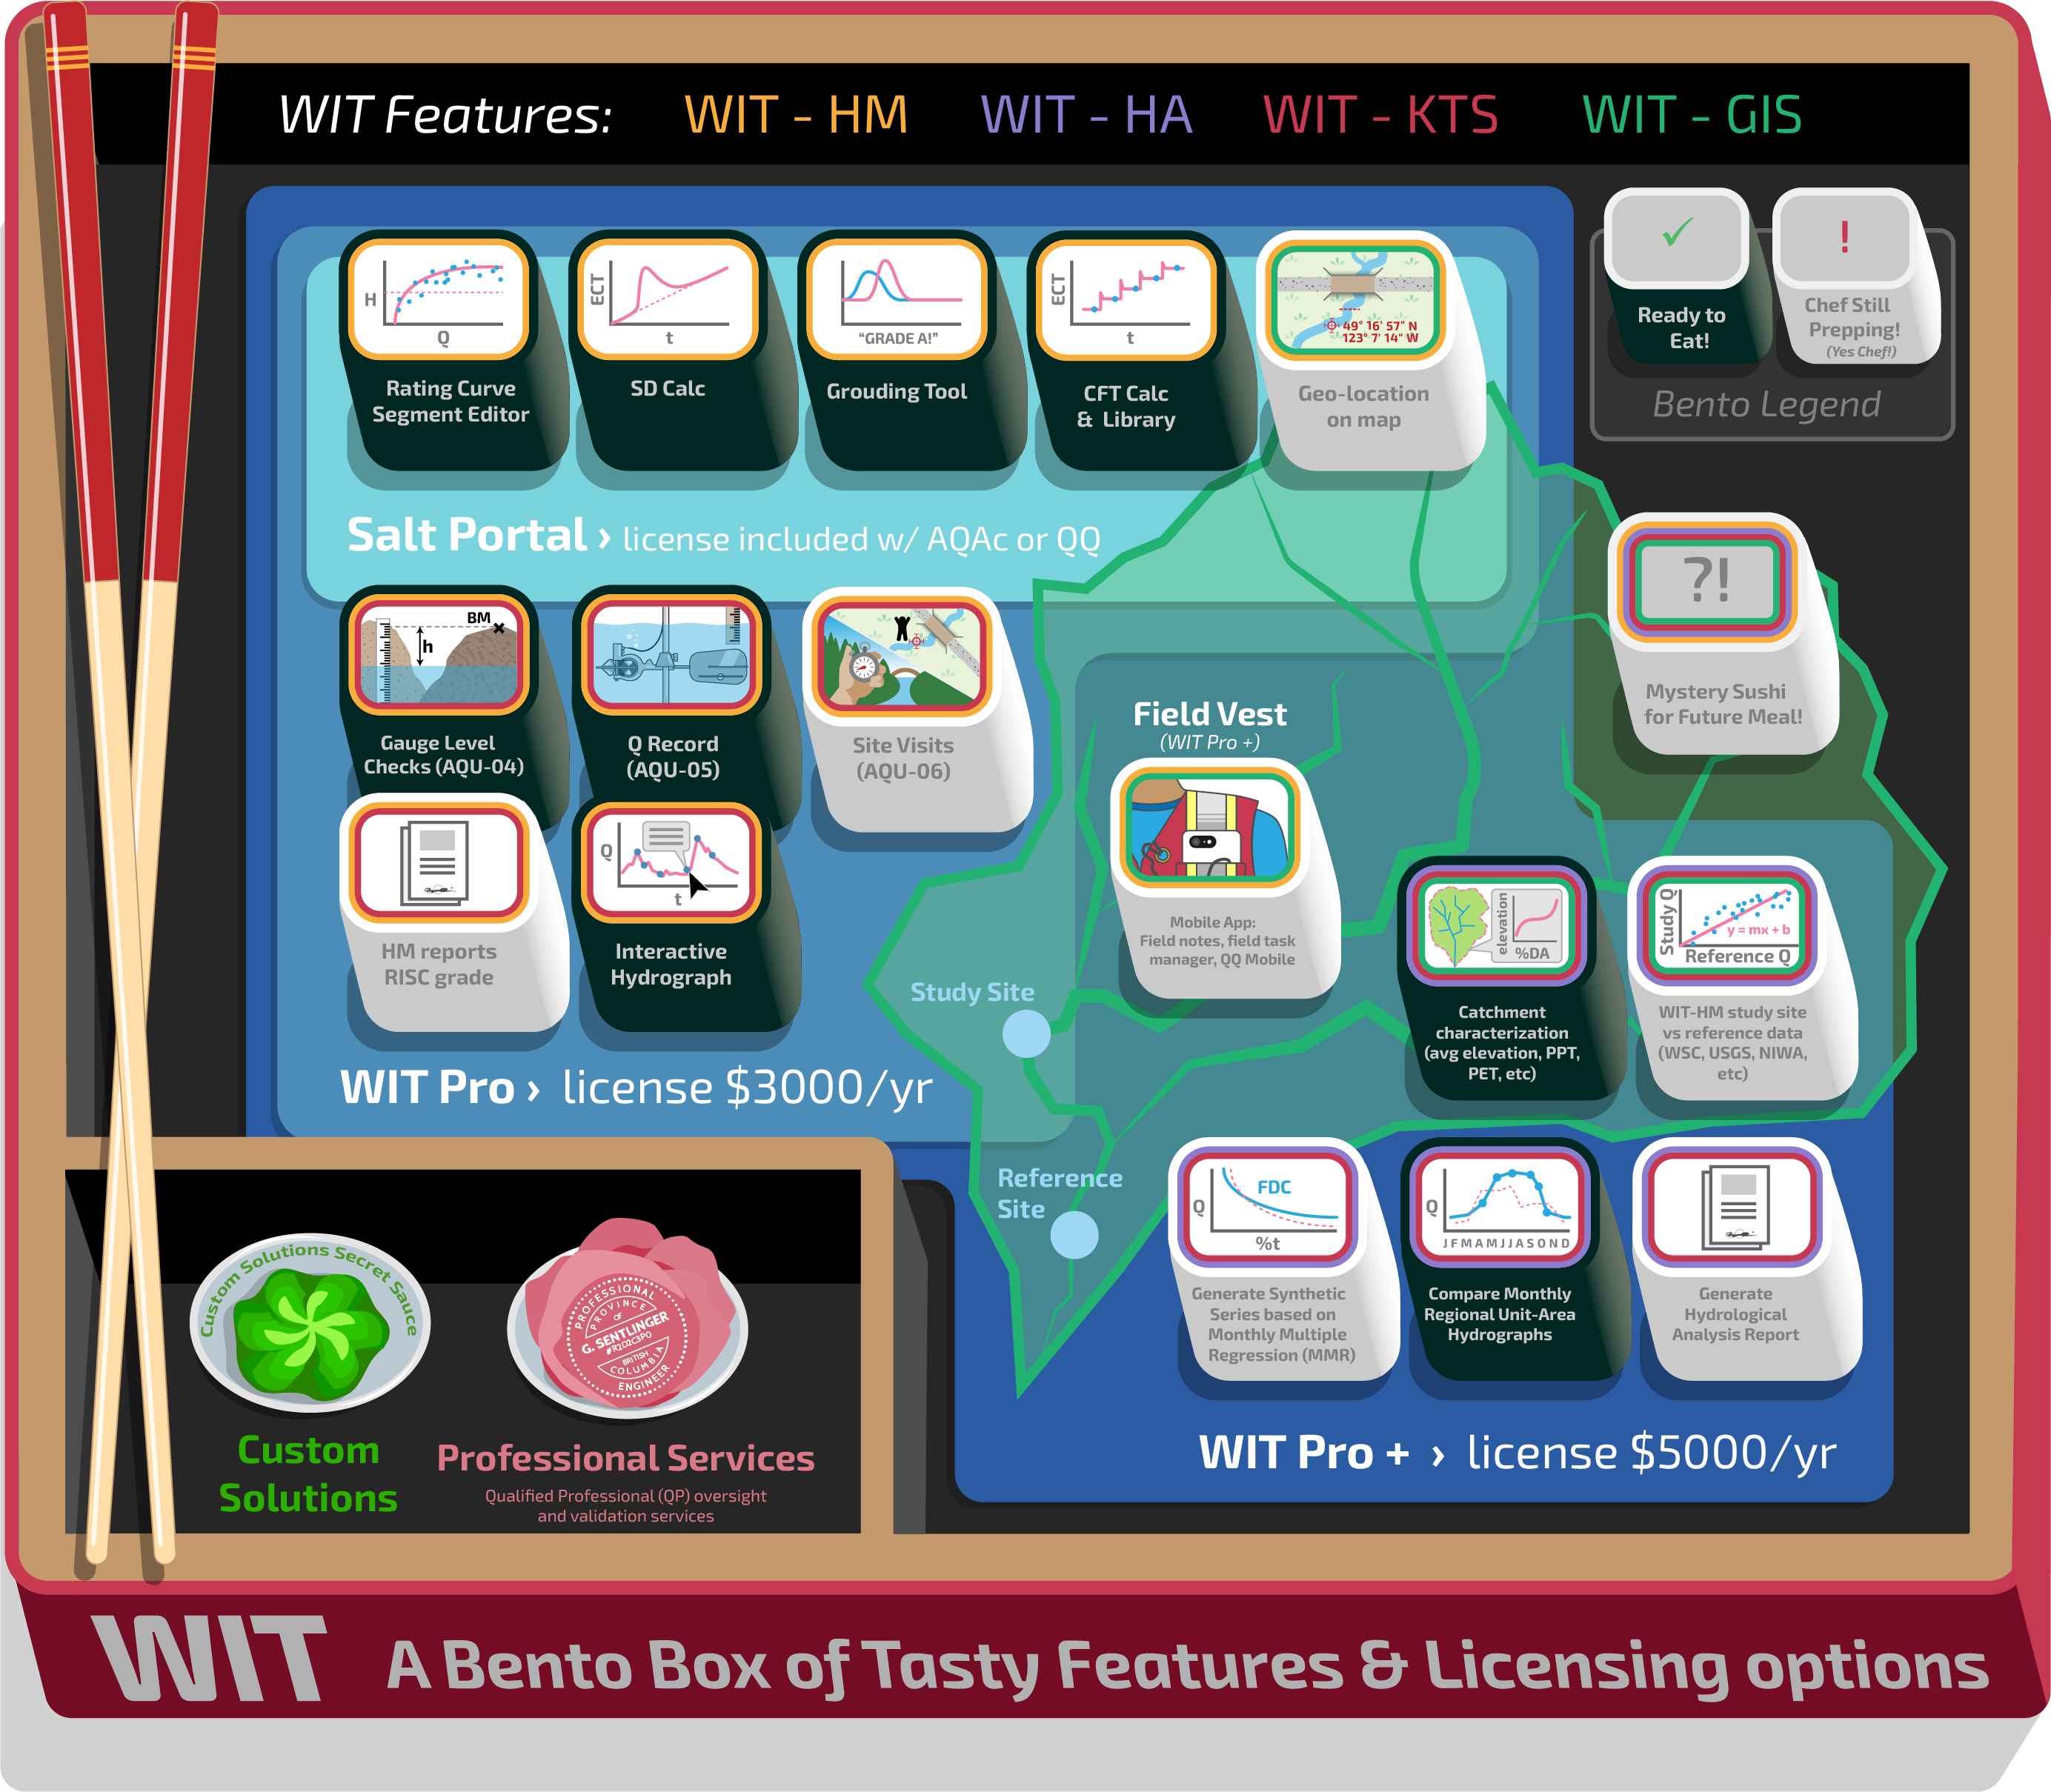
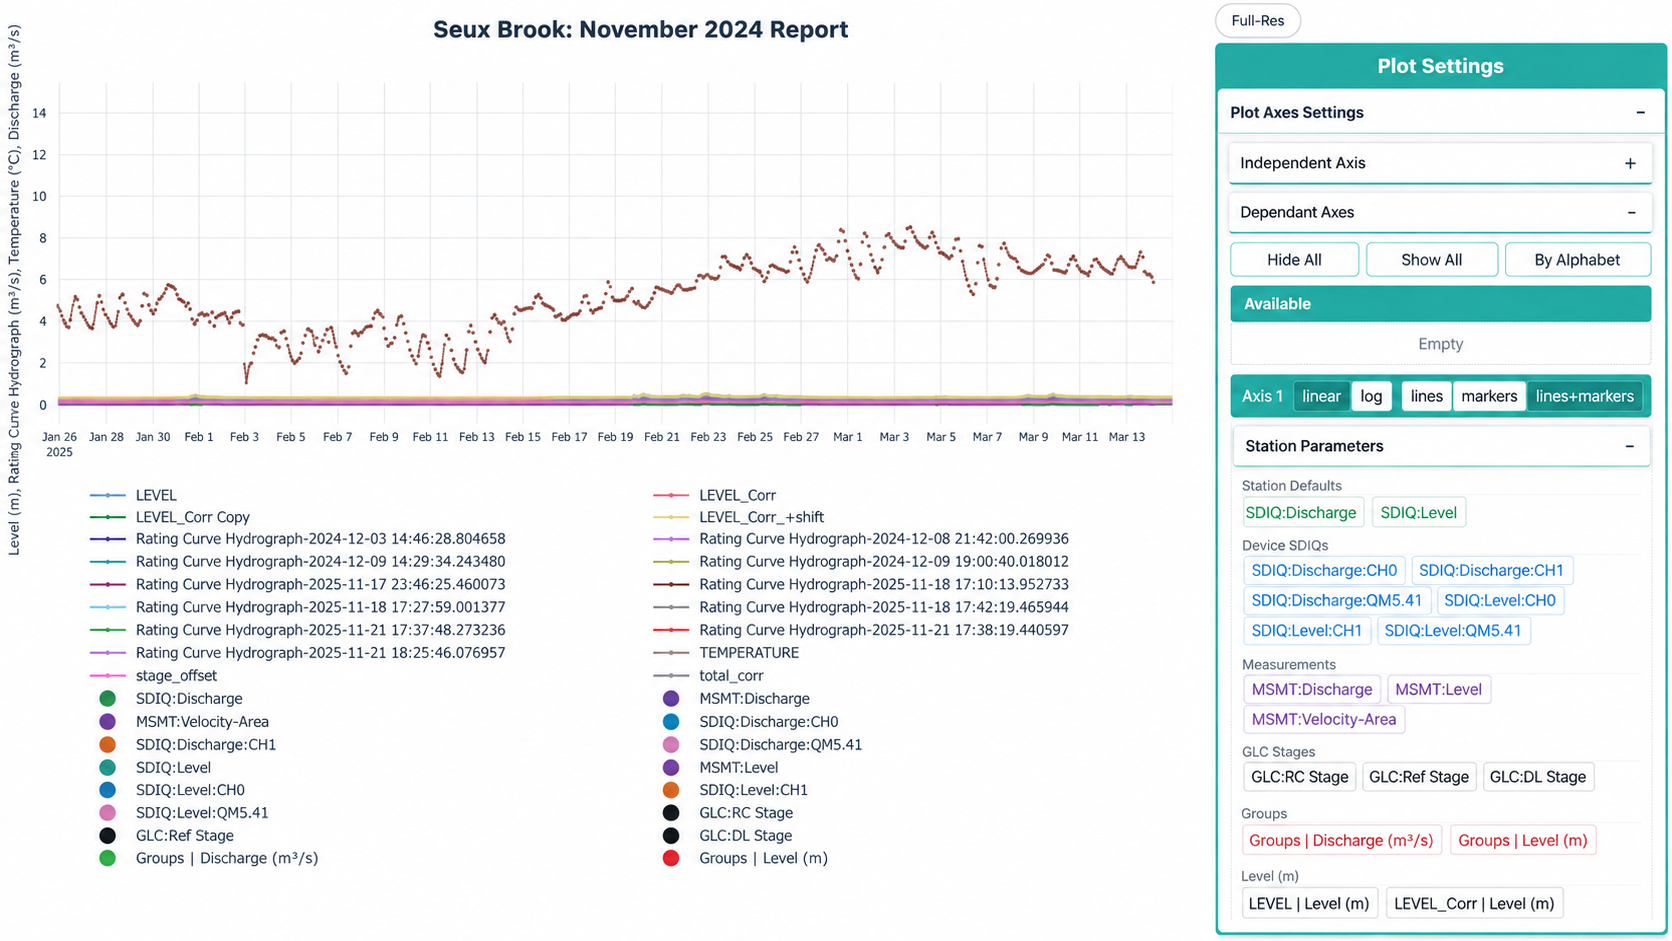
Fathom’s WIT is a new online hydrometric management tool. We’ve crafted two integrated suites of hydrometric tools, working in symbiosis, to offer you a powerful, friendly, (and fun!) way to manage your hydrometric data. They are: WIT-HydroMetric (WIT-HM) and WIT-HydrologicalAnalysis (WIT-HA). Powered by the WIT-Kronos Time Series (WIT-KTS) and WIT-GIS engines, we’ve sautéed these tools into a satisfying webportal meal, so your data is available anytime, anywhere (…there is internet… or served locally). With the Kronos Time Series (KTS) and WIT-GIS engines you can manage your discrete site visit measurements, your continuous time series, and put the reduced data (like hydrographs) into regional context.
Reasons to love our WIT

Save Your Time
Data Wrangling from multiple sensors, different vendors, unusual technicians, and odd sites makes for costly and problematic data management. In the best case, these problems lead to data gaps and non-compliance; in the worst case, they can lead to permitting delays. A day of lost production at a hydropower station or at a mine, can mean 10’s of $1000’s of dollars wasted. On the other hand, data properly managed, with built in QA/QC, Compliance Reporting, and Standards Grading can quicken the permitting process, expedite your annual reporting, and alleviate your headaches.

Save Your Coins
We don’t need a third Range Rover, the vacation home in Maui can wait! We want to help you, the struggling hydropower developer, the hapless VP Environment of the underdog Gold mine, and the lonely, lonely consultant. To that end, we are basically running a charity. We are relying on volume and shared success to fund further development of our shared WIT.
Let our WIT do the hard work for you
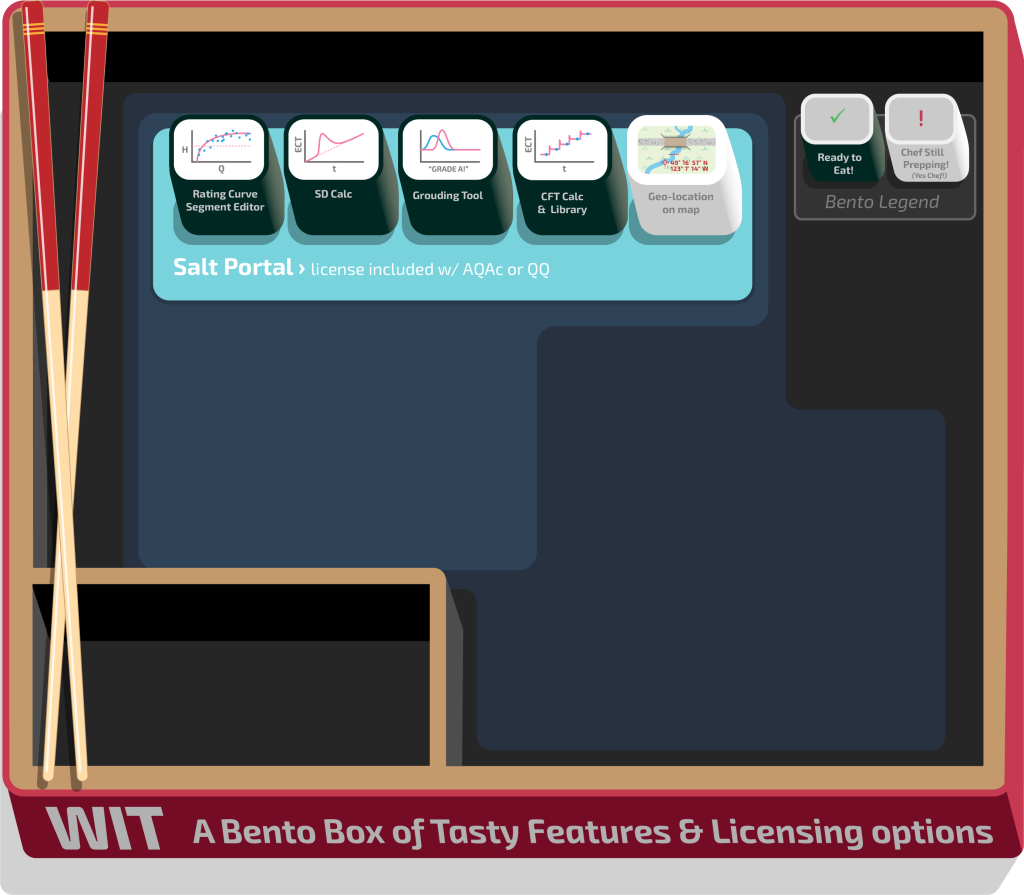
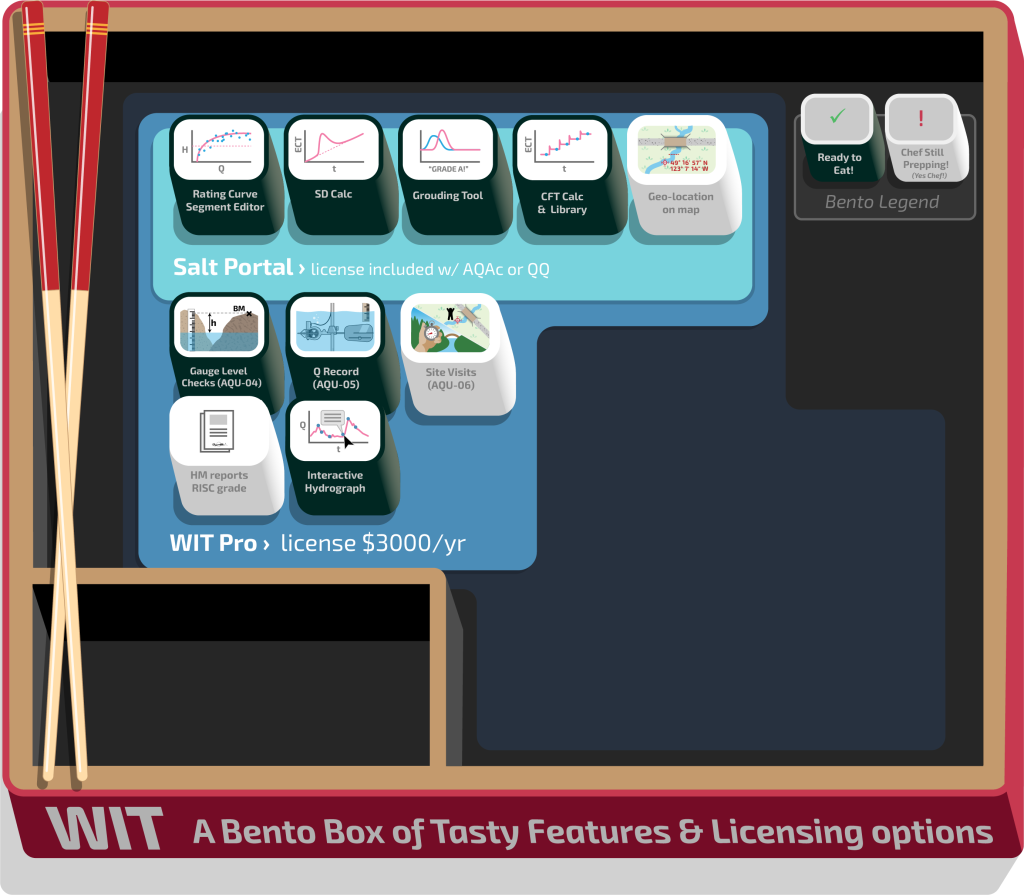
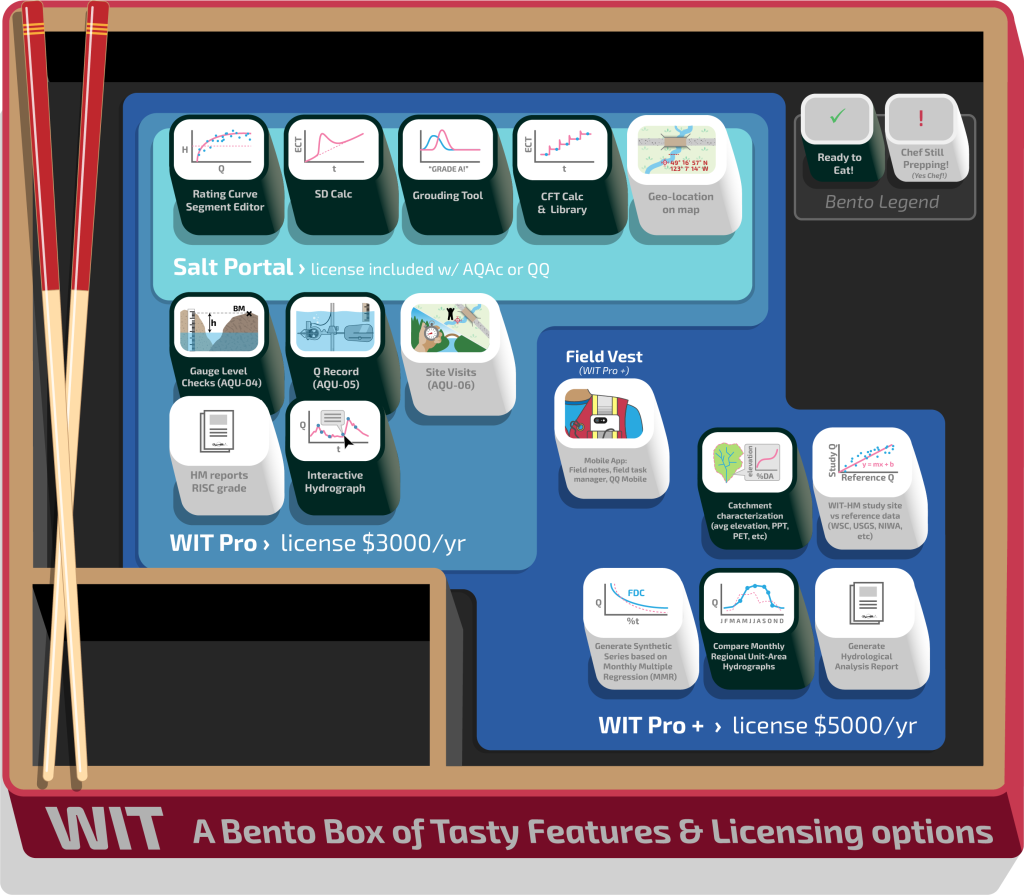
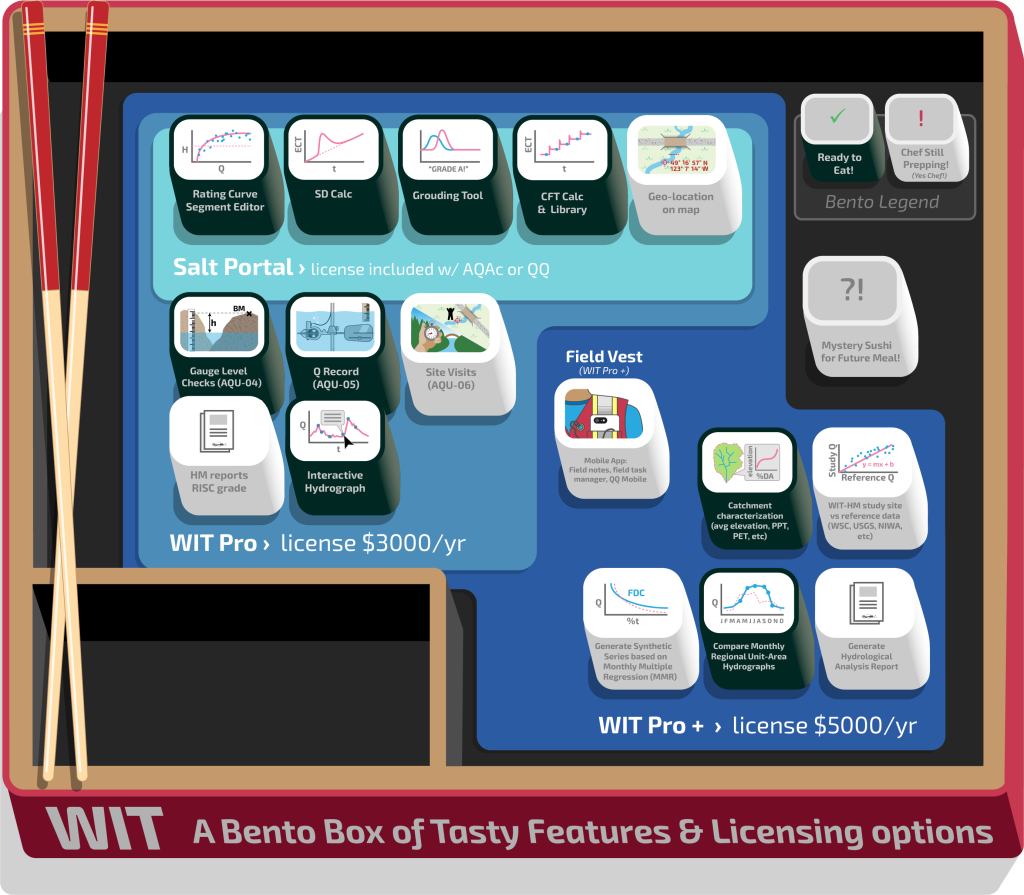
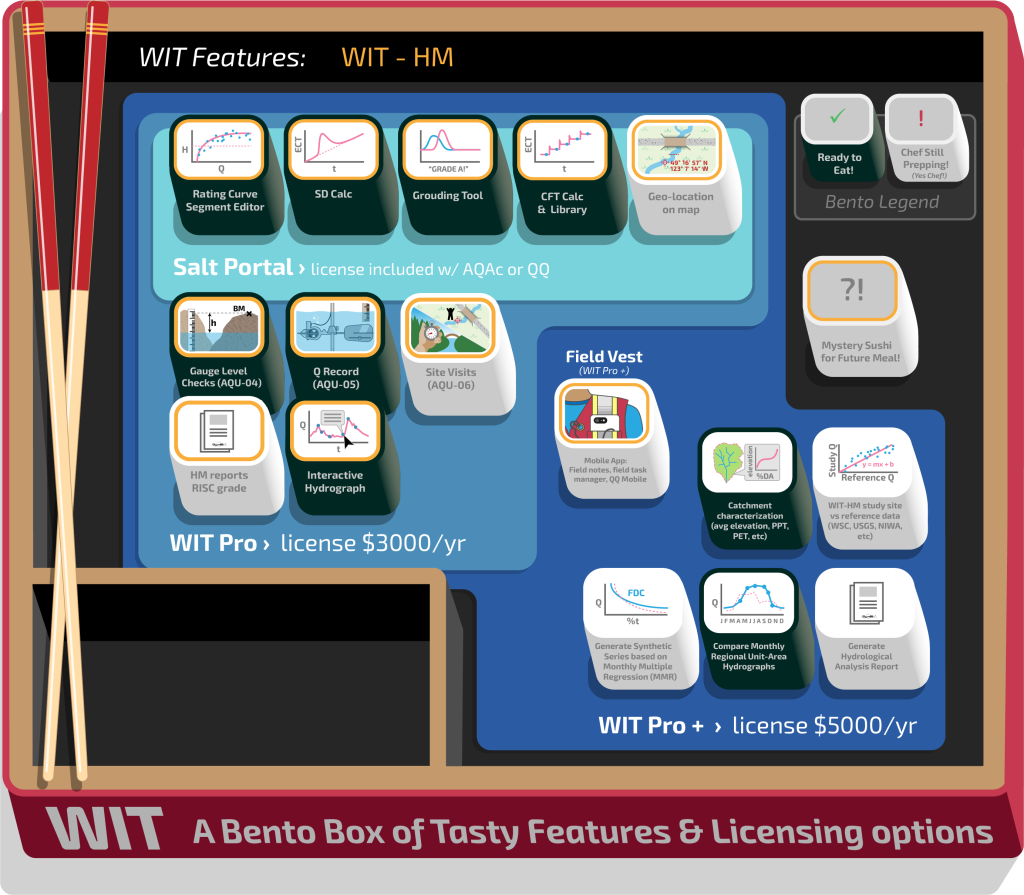
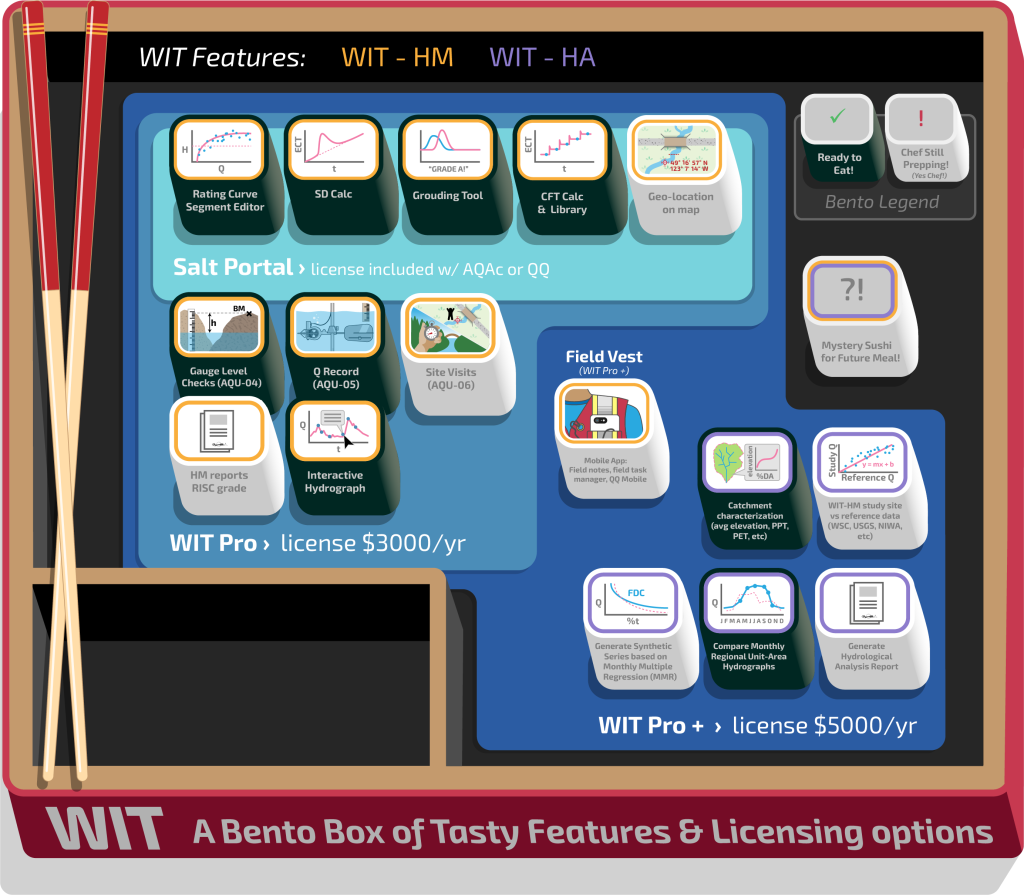
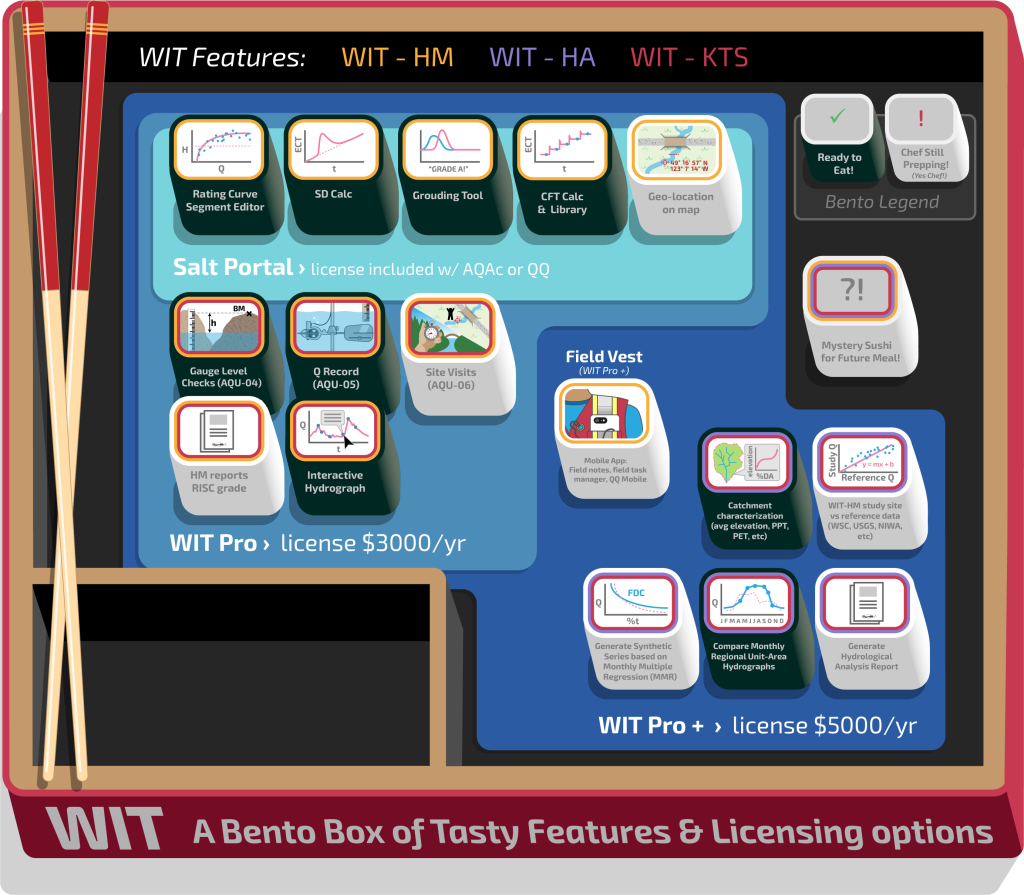
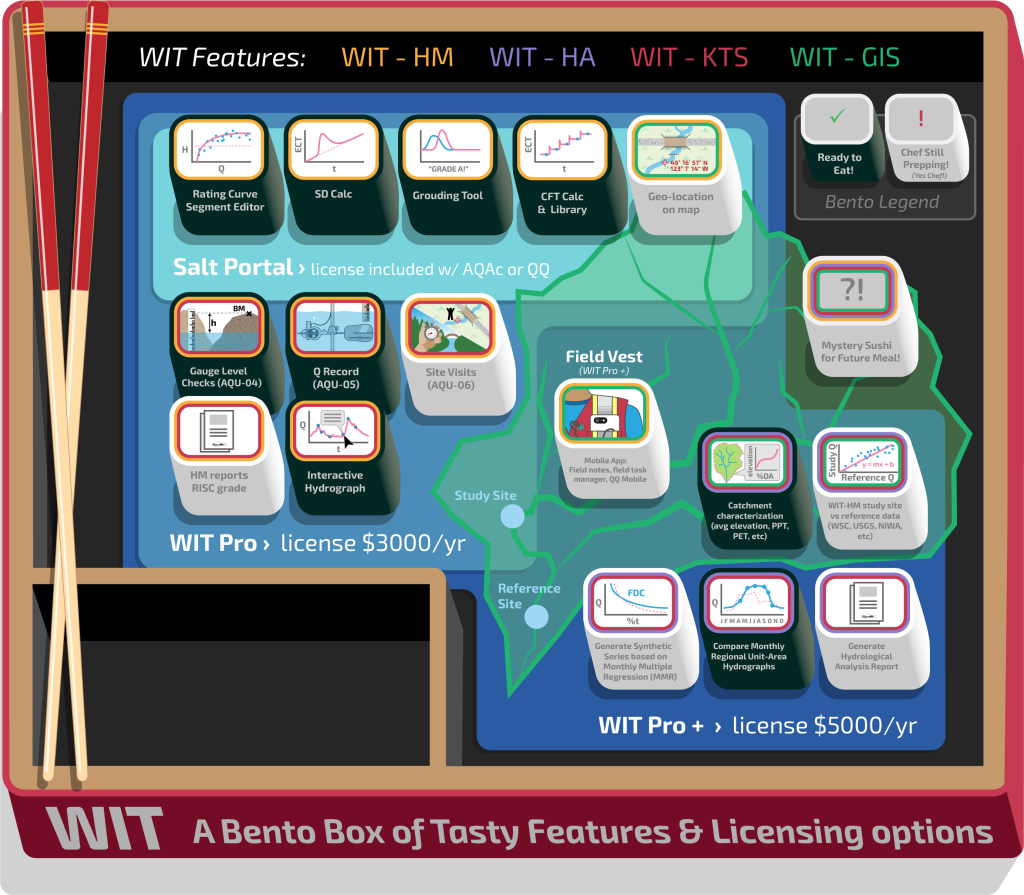
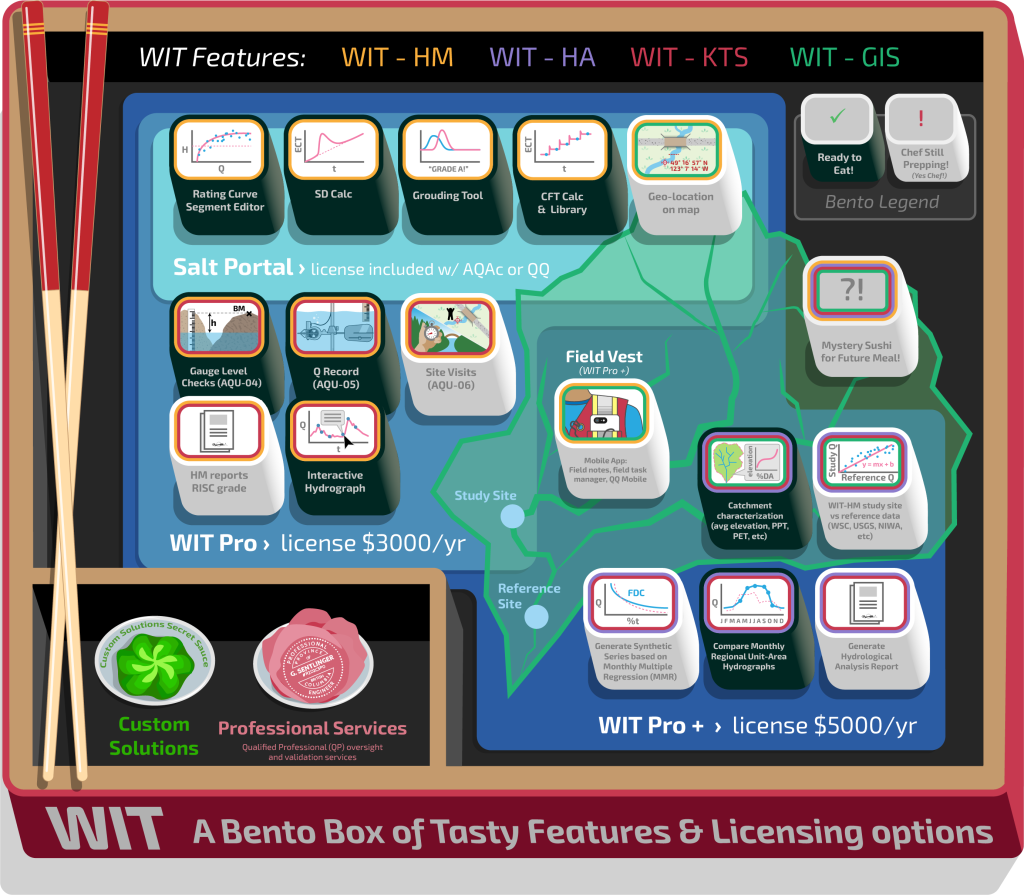
WIT is designed to allow rapid post-processing of Salt Dilution measurements, specifically from the QiQuac kit or the AutoQAc system, but will work with any SD measurement. QA/QC processes help the professional assign a Data Grade (A, B, or C) based on local standards. Measurements and Time Series Ranges can be locked by supervisors after validated for a complete audit trail.
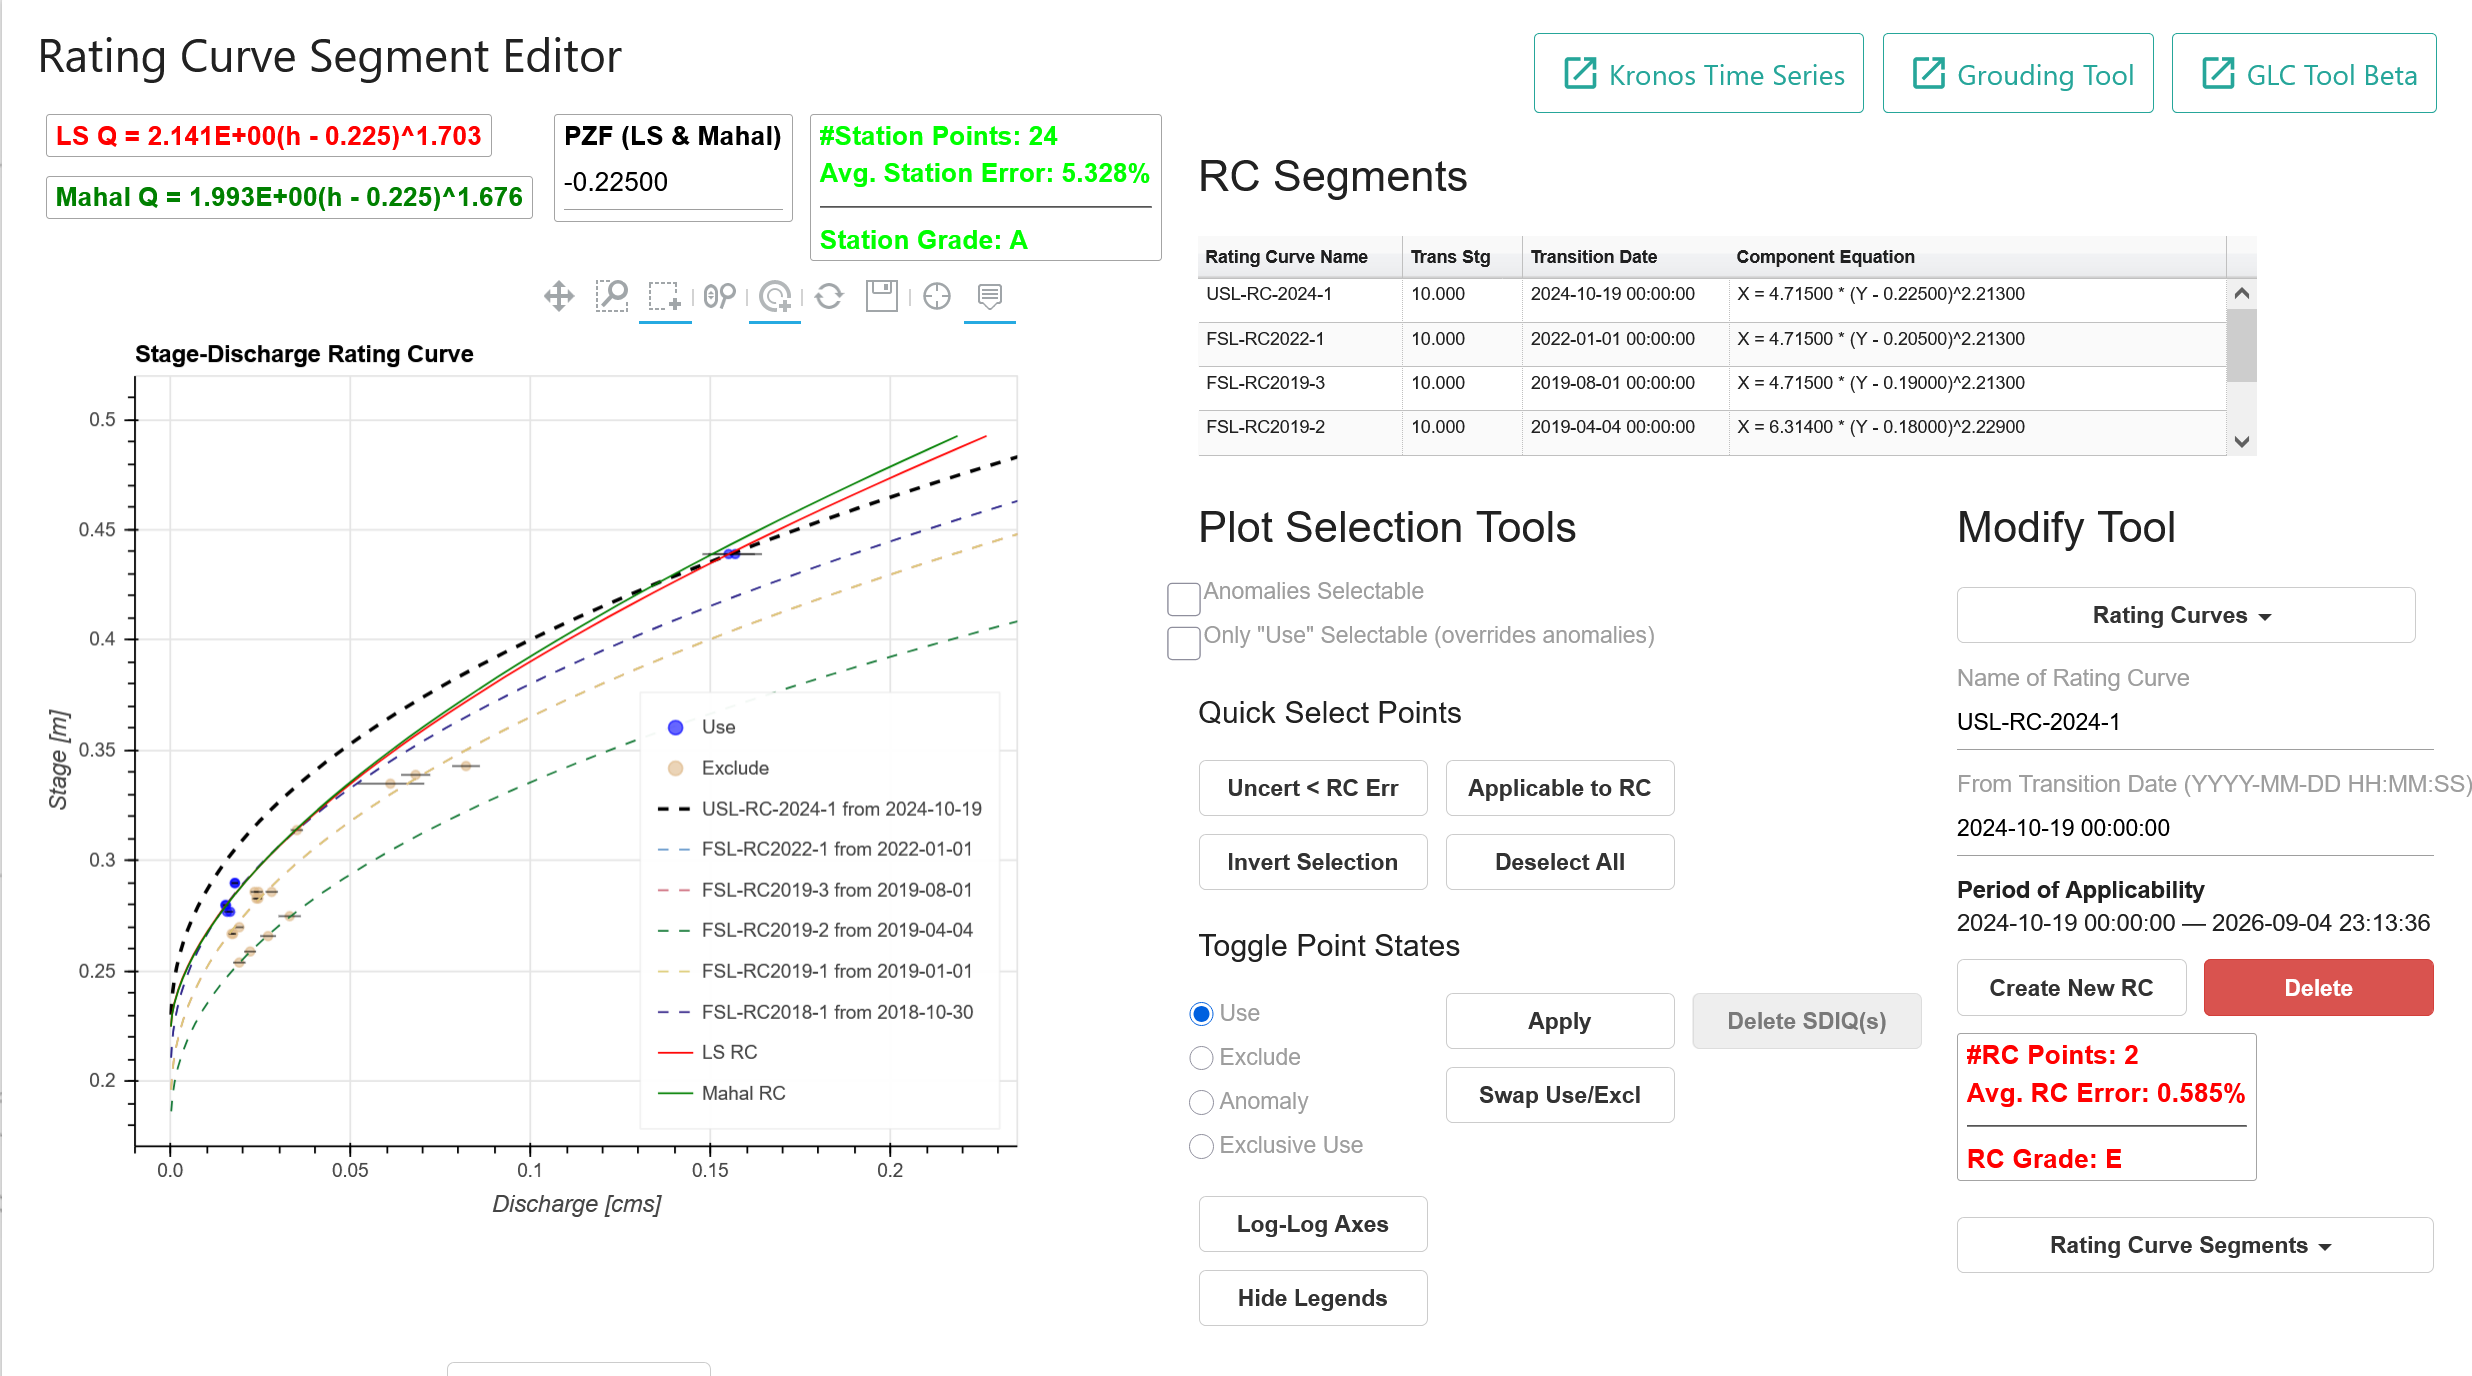
Rating Curve development is done in an interactive fashion using a Least Squares or Maximum Likelihood Hydraulically Based RC algorithm, taking into account measurement uncertainty as well as channel characteristics. NEW: BaRatin integration for Bayesian rating curves with uncertainty.
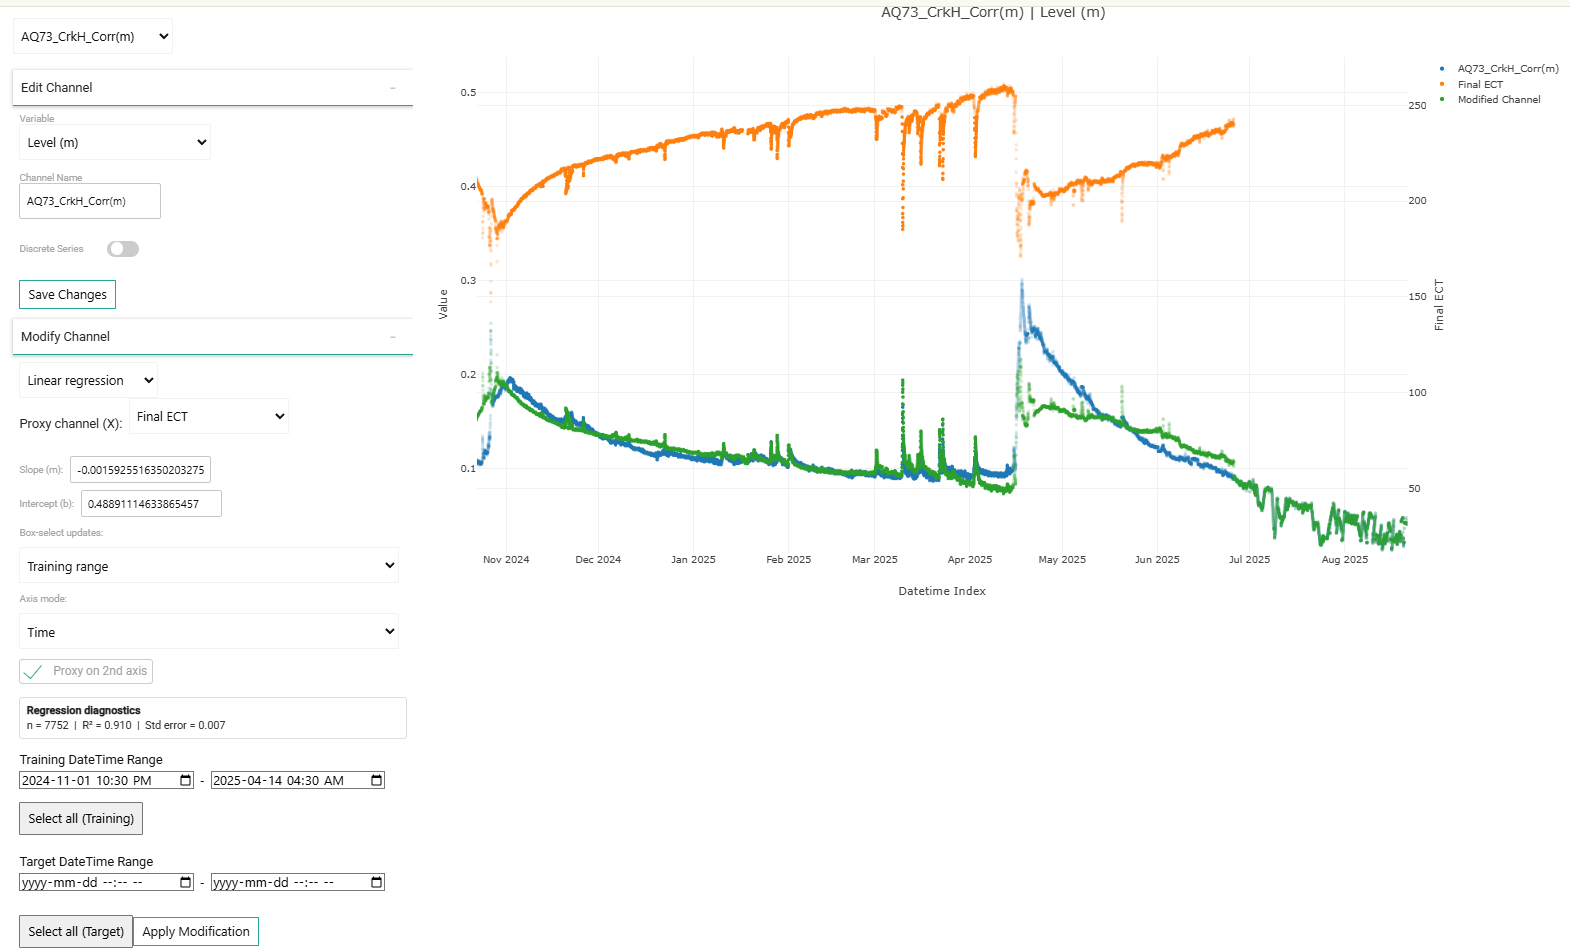
Regional regression methods between hydrometric stations will allow both QA/QC of the hydrometric series, as well as hind-casting of short term records to longer term synthetic series in an intuitive, rigorous, and accurate manner, with uncertainty estimates.
We intend to automatically generate editable reports of hydrometric and hydrological analysis, with regional estimates for comparison. Integration of HydroRecon analysis in future iterations will allow users to quickly assess hydropower potential with economic analysis.
WIT – HydroMetric (HM)
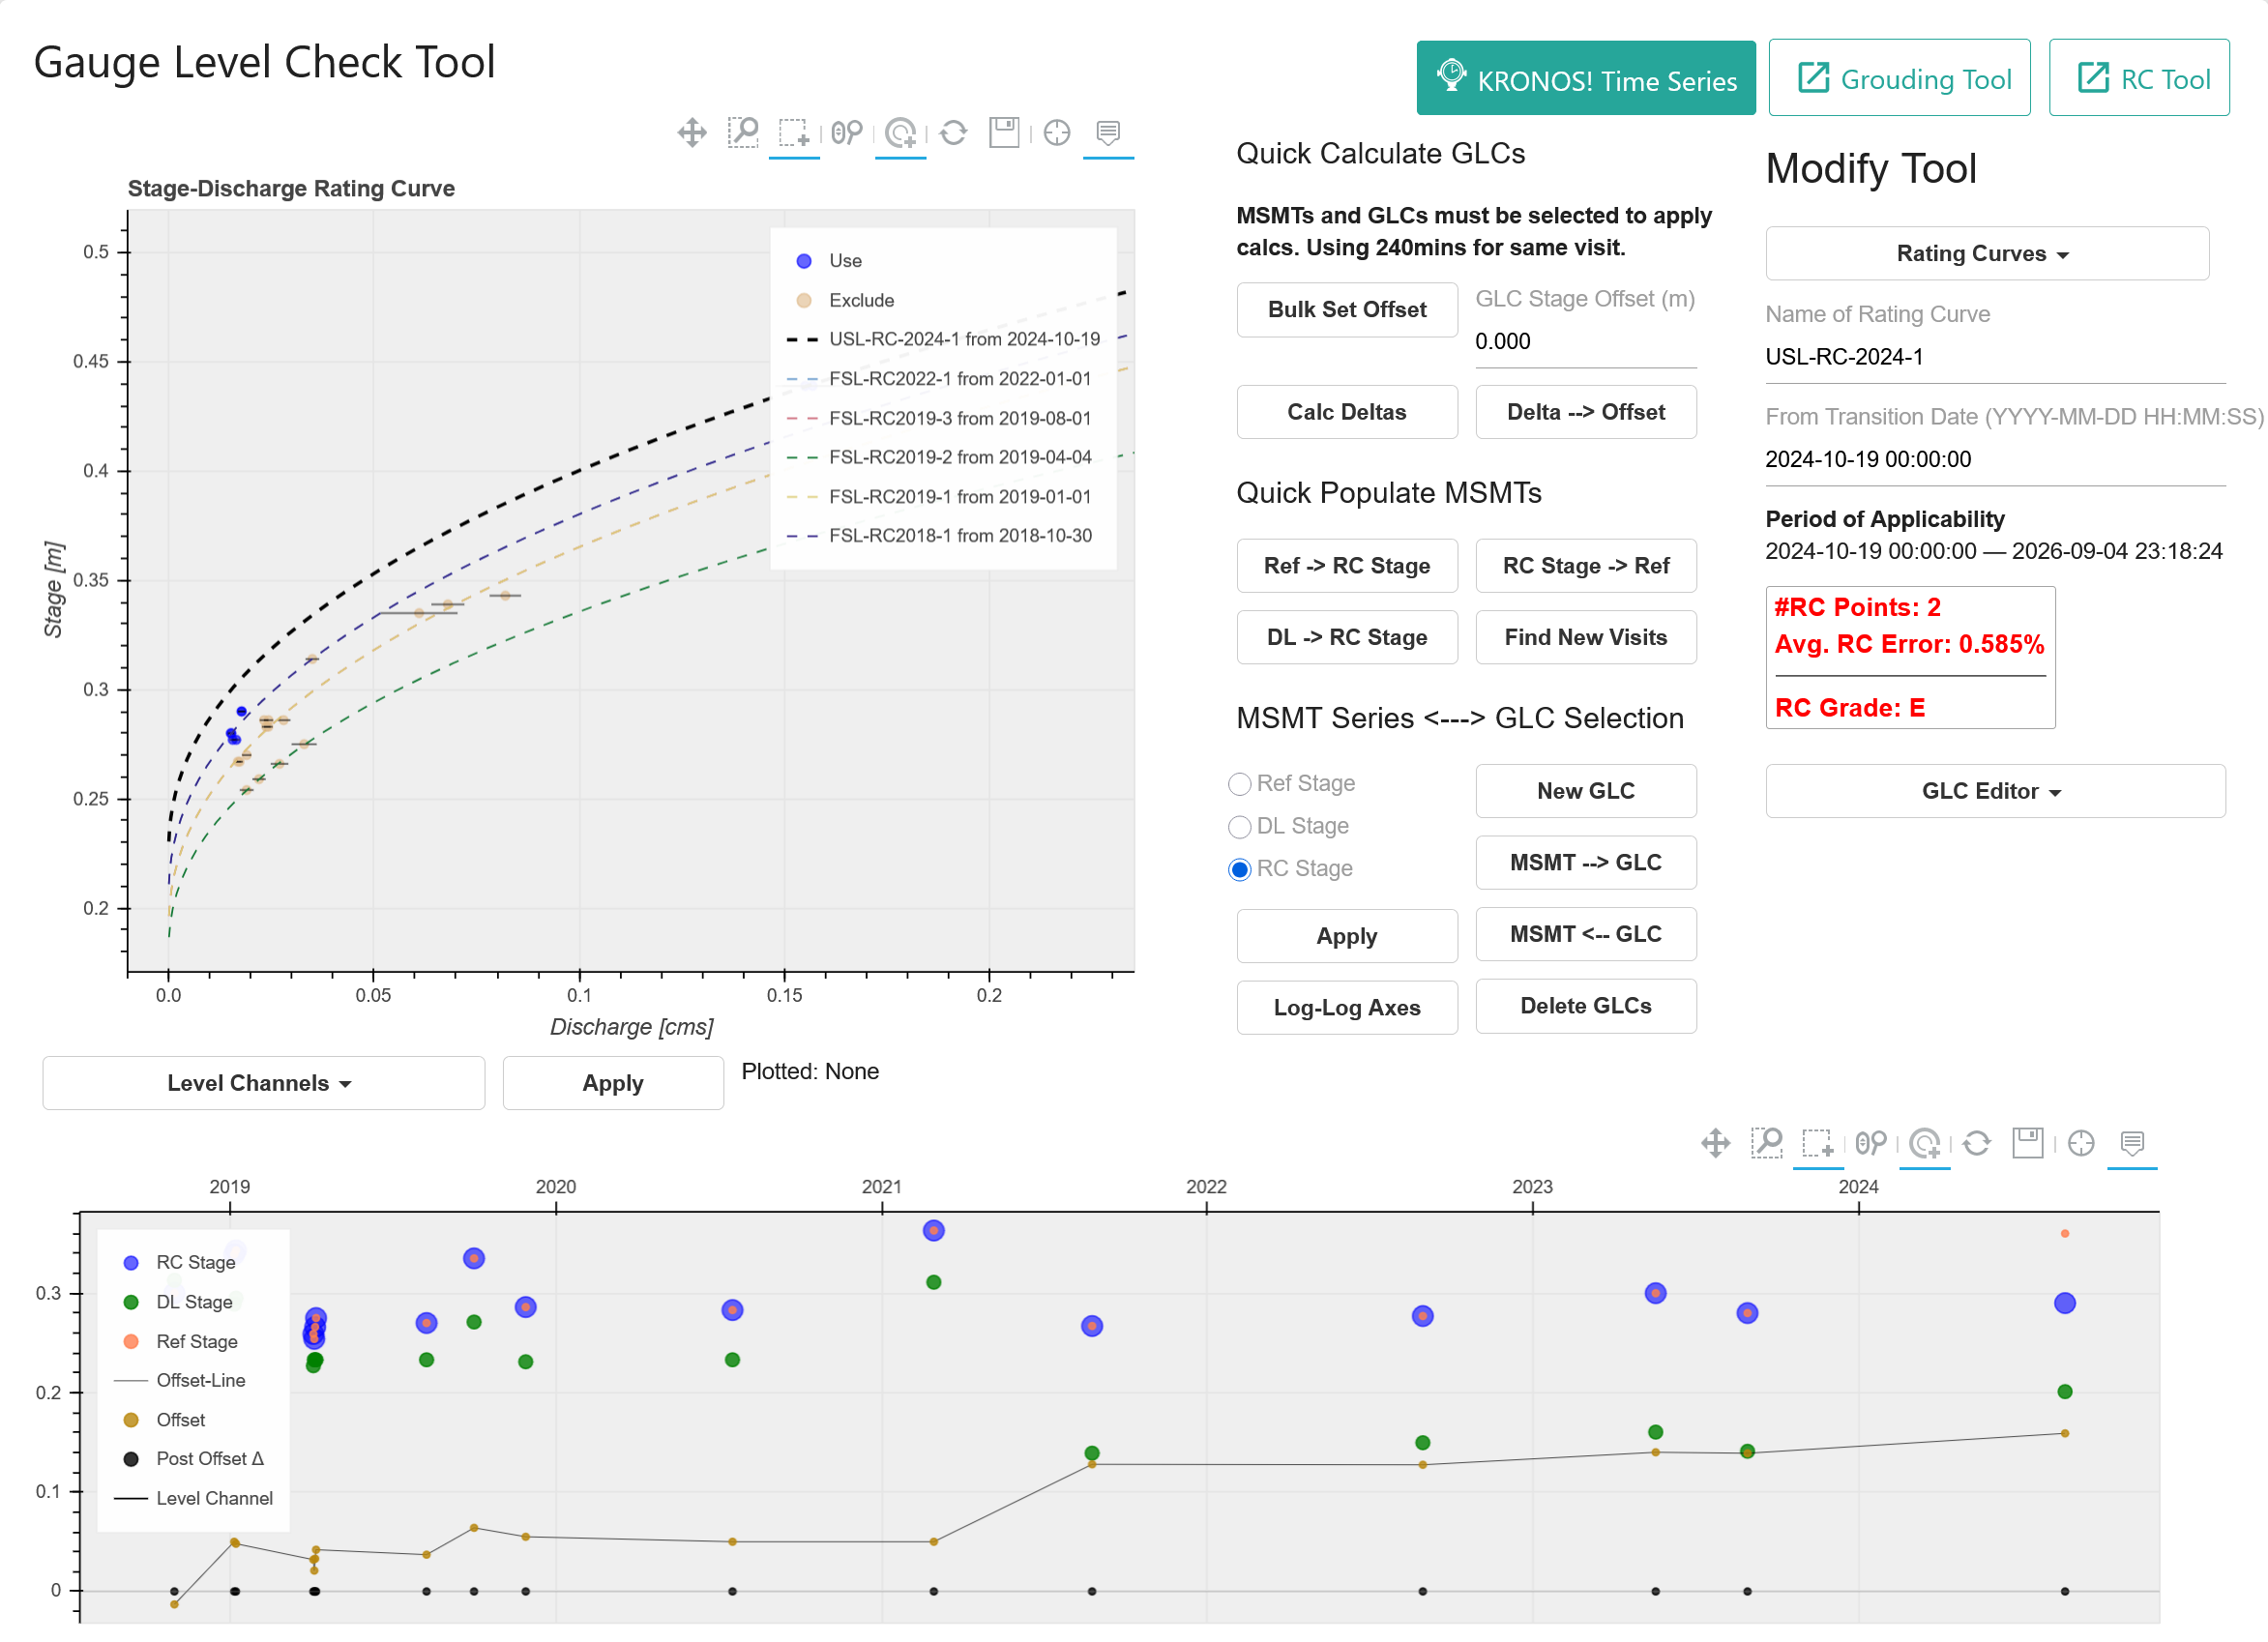
WIT-HM is your one stop boutique for storing, viewing, fanangaling, and QA/QC’ing your QQ, AQ, and T-HRECS data, along with stage, gauge level, checks, and benchmarks. Pairs nicely with WIT-GIS to find your stations, calculate drainage area and other Geo-Stats. Add a side of WIT-Field Vest to take notes in the field, record photos and video (with audio), measure flow with QQ Mobile or the QuickBucketTM volumetric flow aid and see where your points fall on the rating curve.


WIT – KronosTimeSeries (KTS)
Time is strange. In the moment, it appears to run smoothly, relentlessly, ruthlessly in one direction, the older direction; but in hindsight it’s punctuated by discrete events and touchstones, turning points, a flash of a smile, a phrase of music, and triumph or lesson learned. Kronos Time Series is your companion through all of your hydrometric life events. Faithfully recording the flow of time, while carefully handling your cherished discrete events in the special way they deserve. Combined with place, imagery, and measurement, our aim is to encapsulate your site’s history into meaning, so you can spend your time creating your own memories.
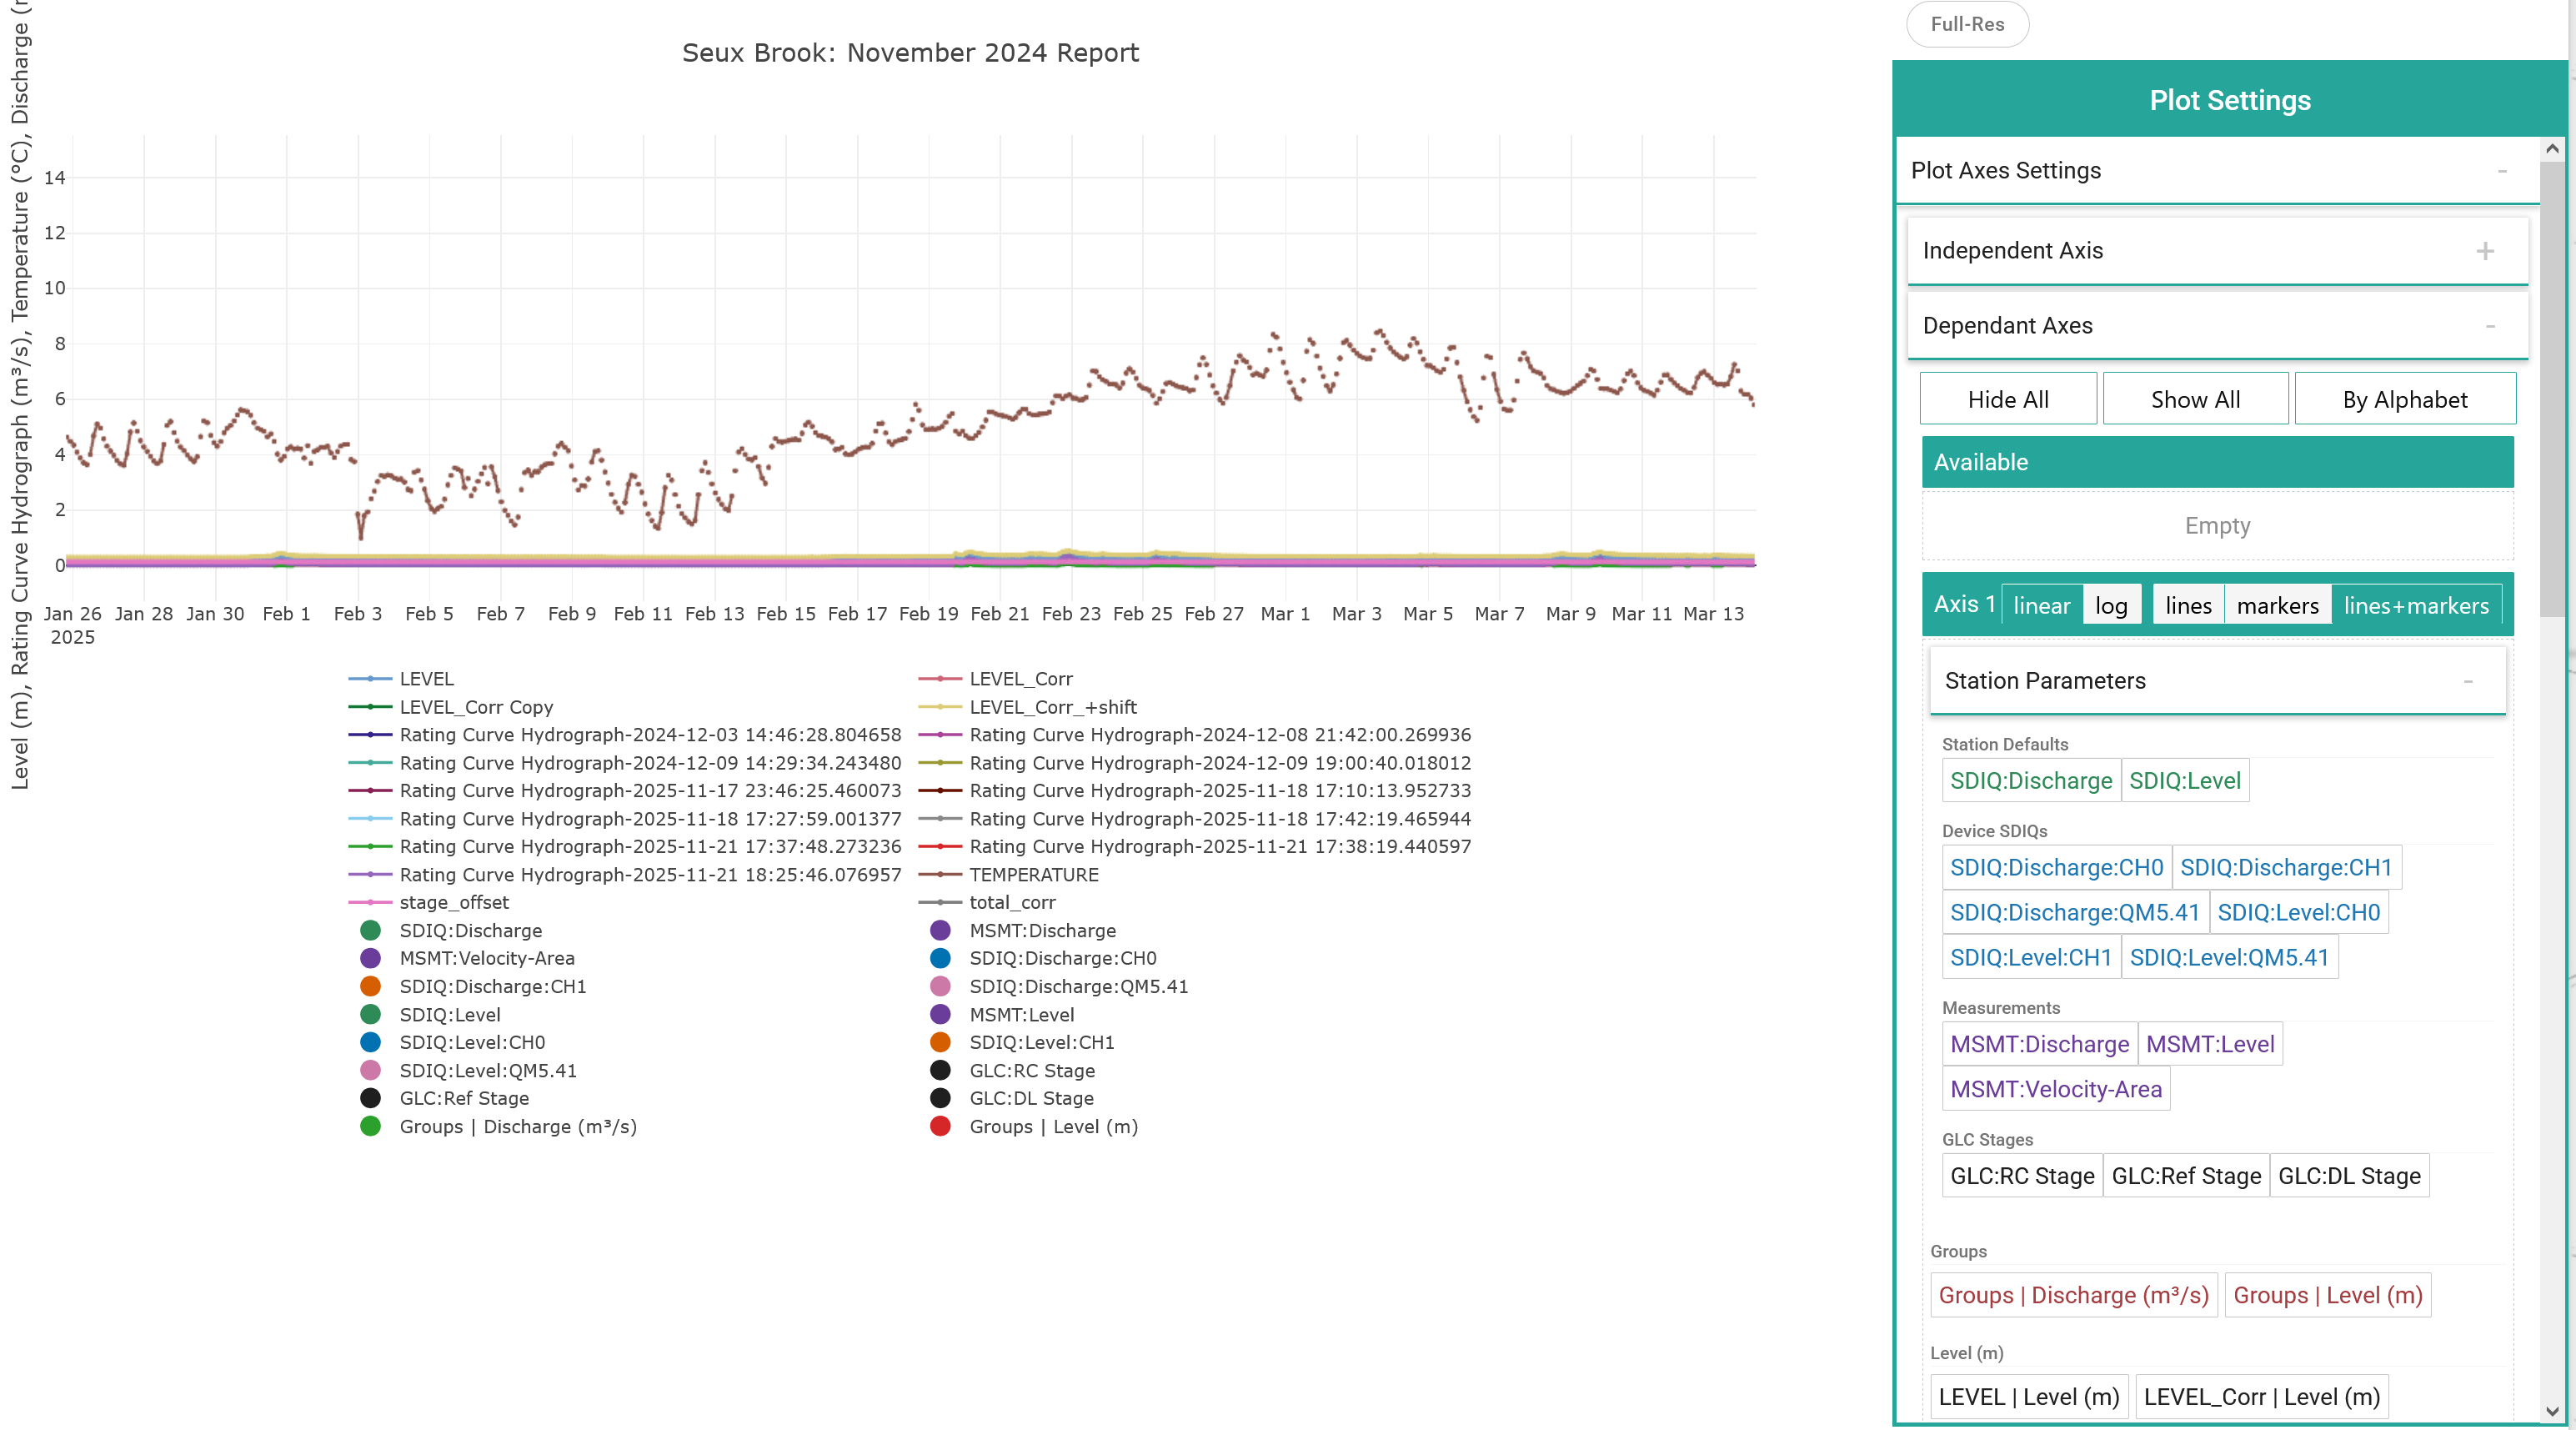
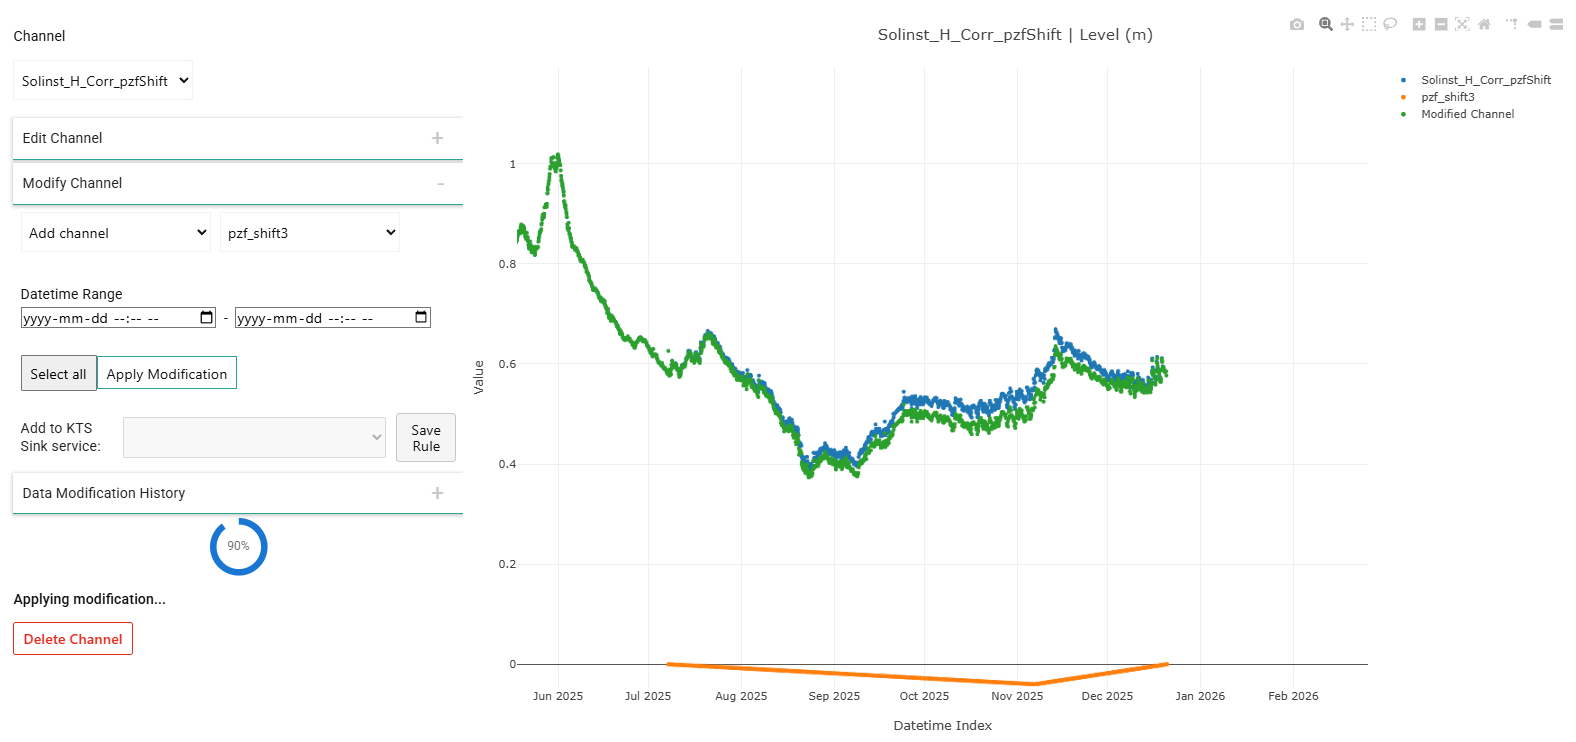
KTS is a versatile data processing and visualization tool that supports flexible manipulation of continuous or discrete datasets to be used as inputs into various models. Powered by D3.js and WebGL, hydrologists are capable of observing upwards of a million time-indexed data to forecast events. It integrates seamlessly with WIT-HM and WIT-HA using a shared PostgreSQL database optimized for rapid ingestion of large datasets.

QiQuac Mobile
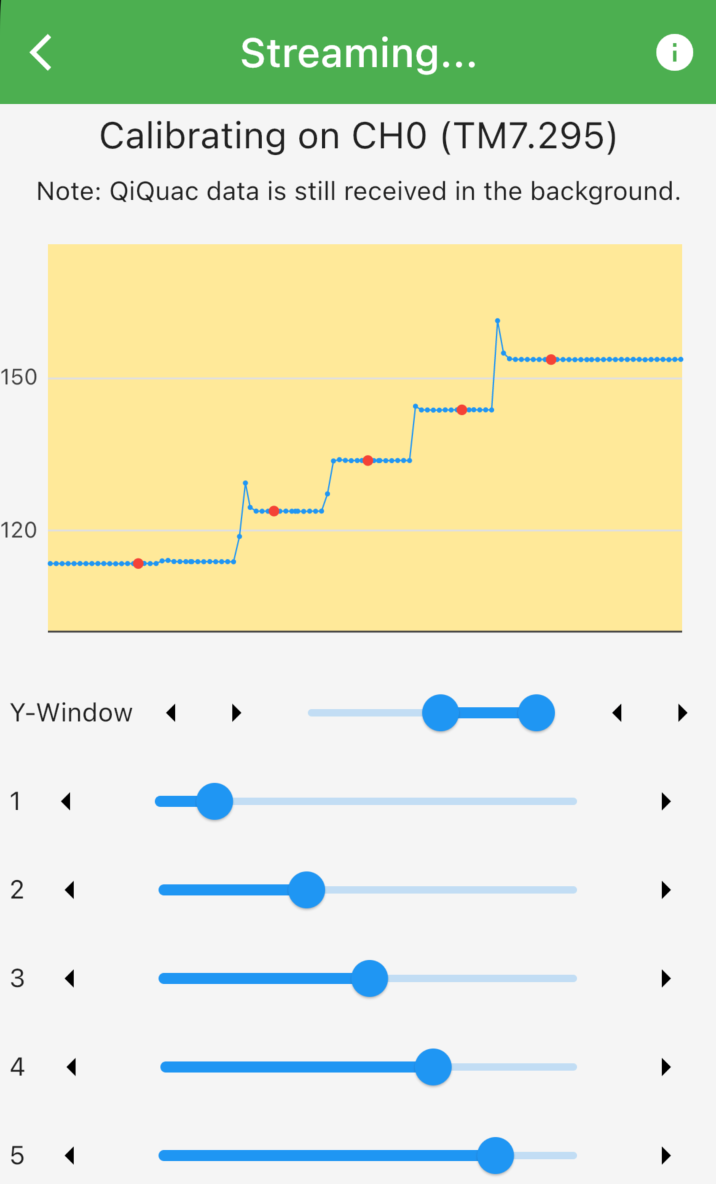
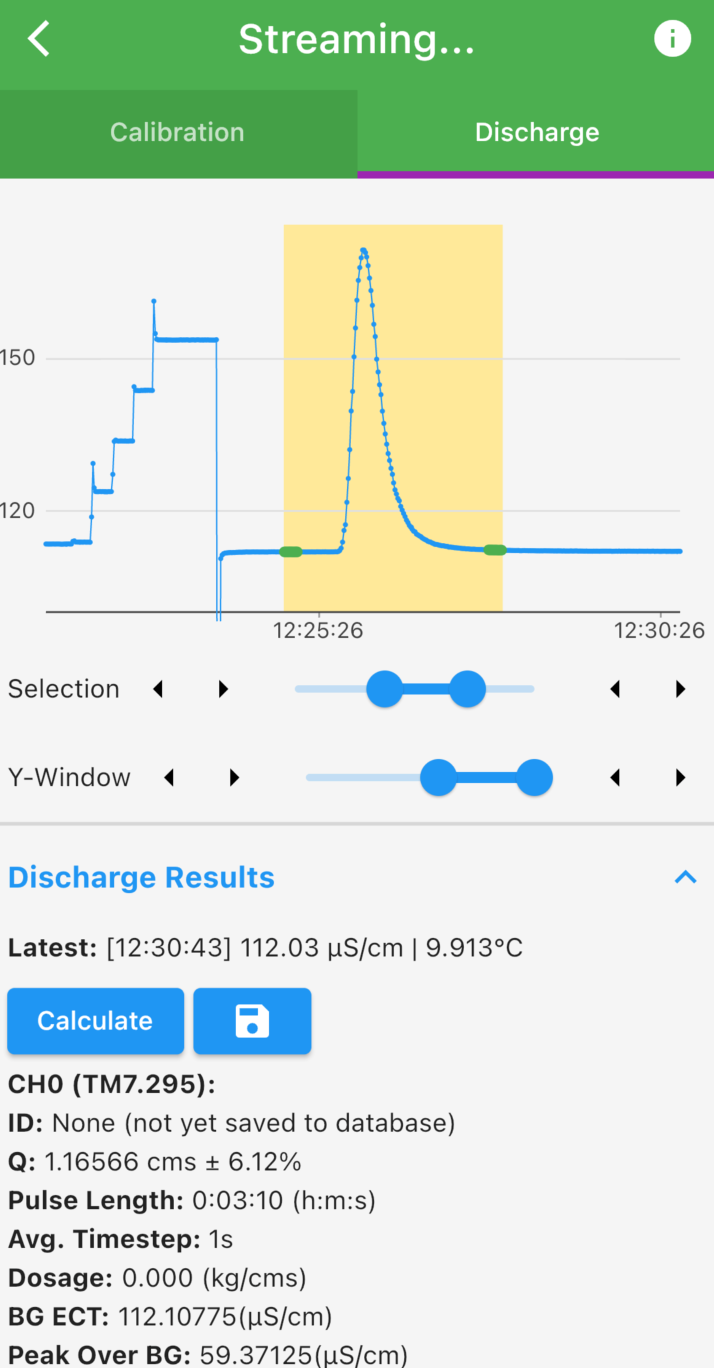
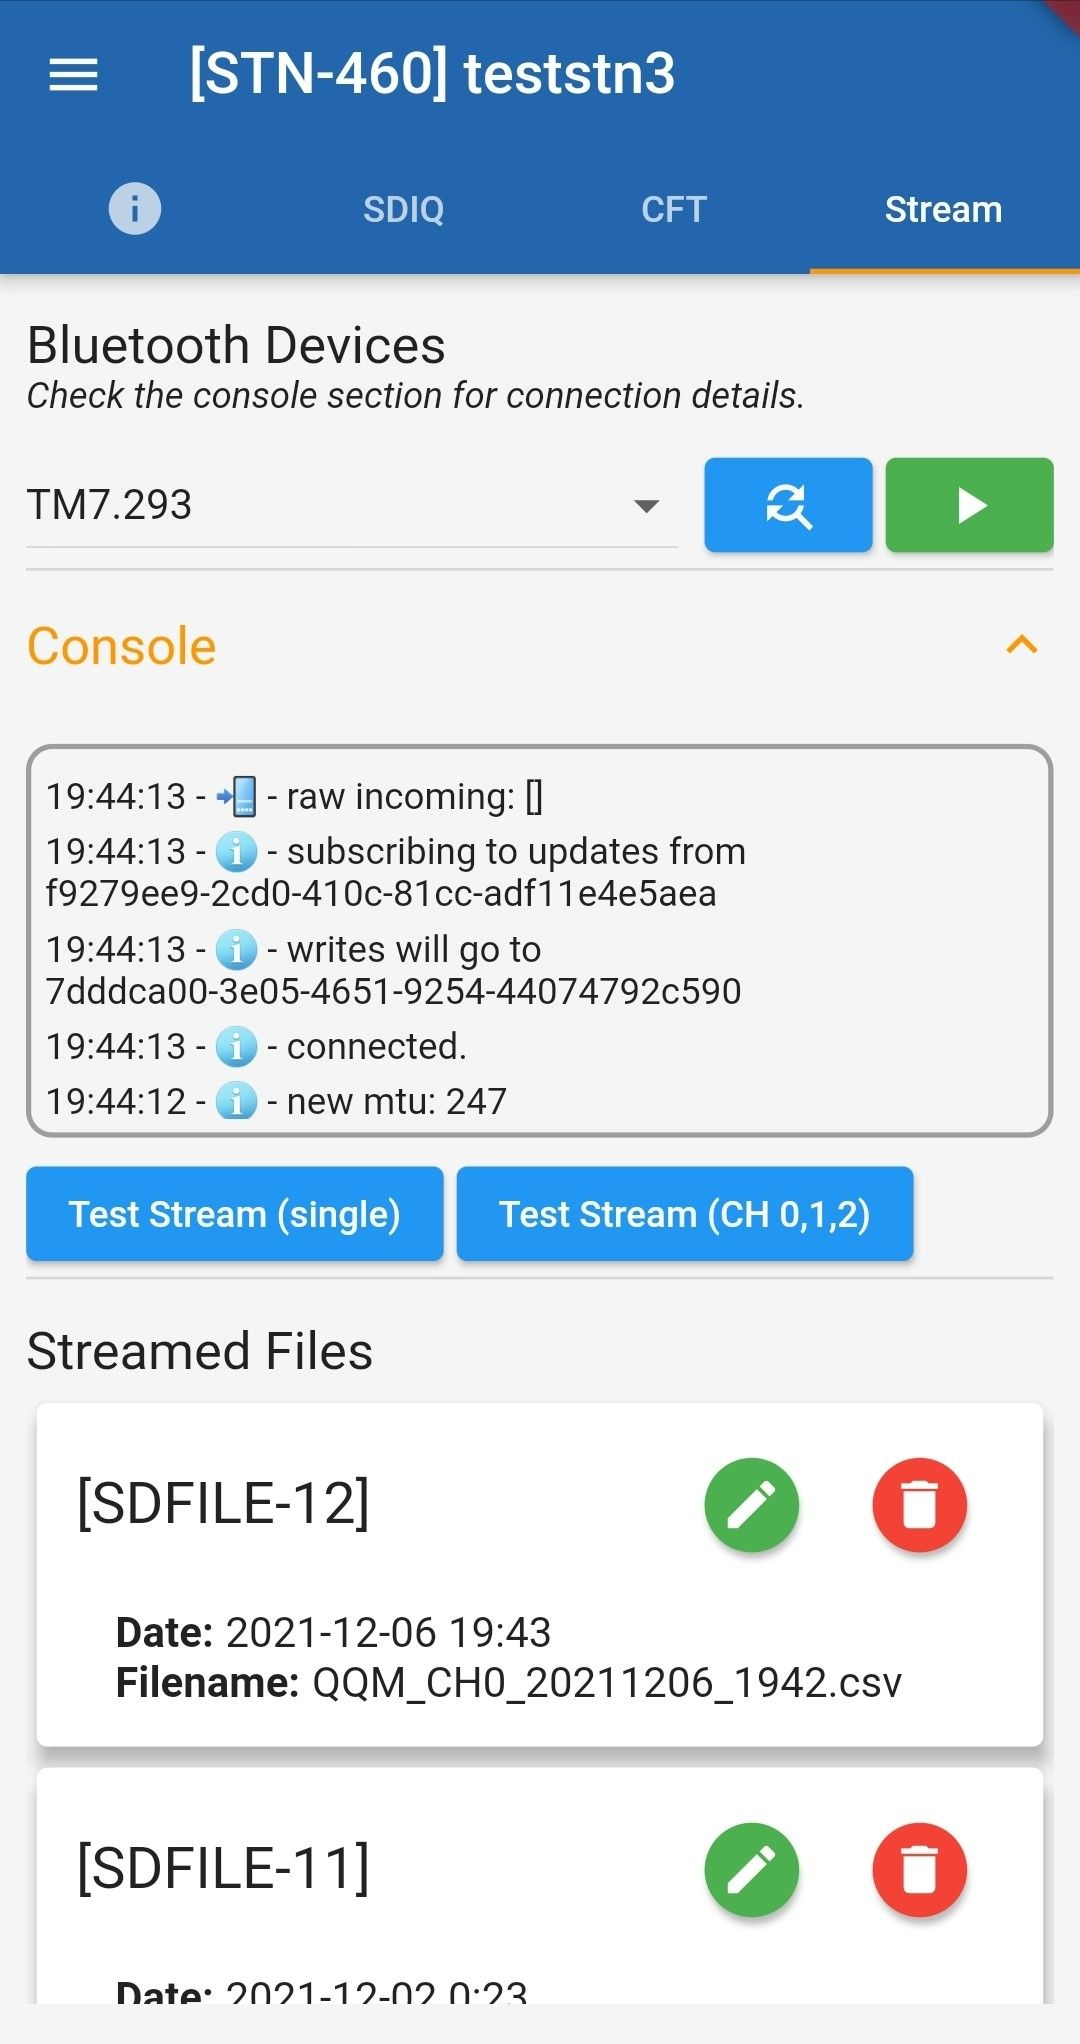
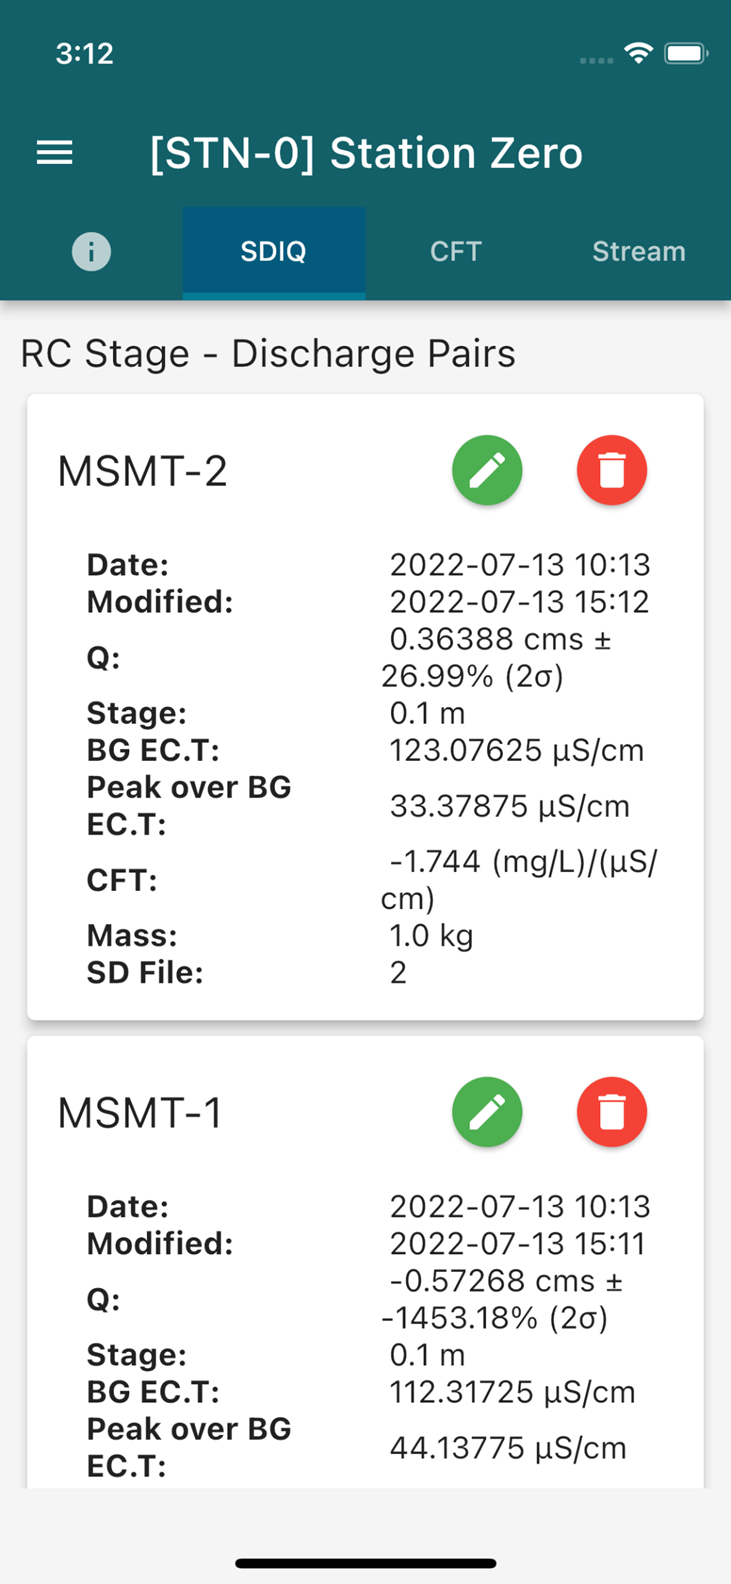
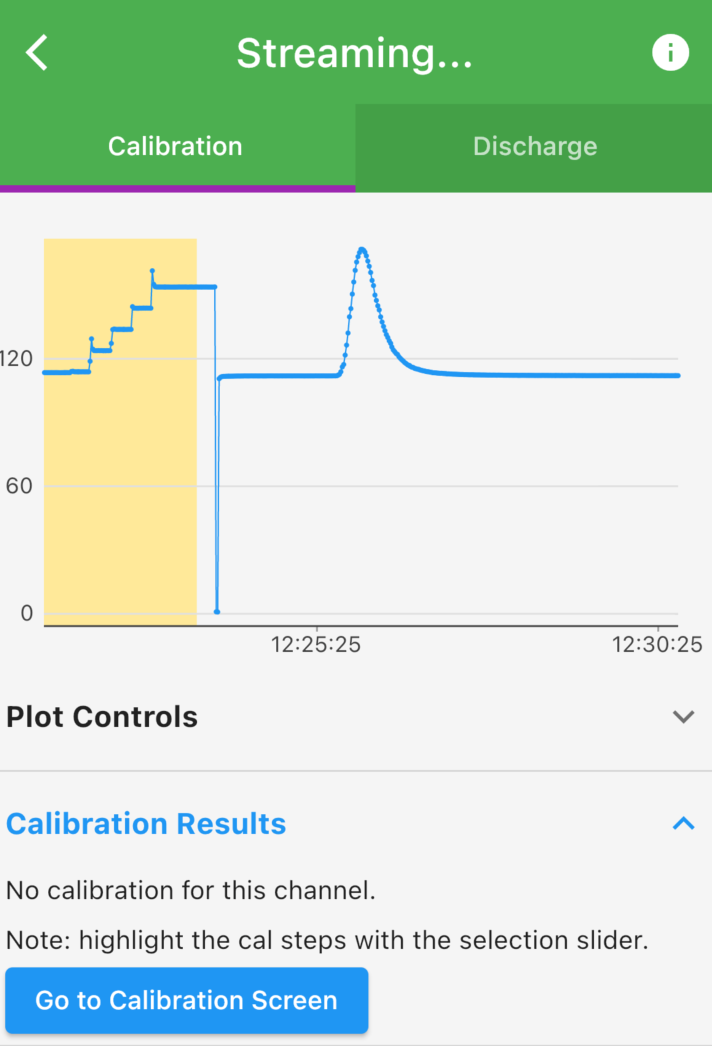
Salt dilution in the field used to mean stone tablets, soggy notebooks, and a prayer the wave looked right. QiQuac Mobile makes your salty life easier so that you don’t have to. Bluetooth to a Fee-Oh or a QiQuac QM5, watch the EC.T pulse live, calculate CF.T and SDIQ (with uncertainty) on your phone, and Grade the measurement before you pull the probes. Works with or without wifi, then syncs your SDIQs up to the Salt Portal mothership when you’re back in civilization.
Works With Fathom Hardware
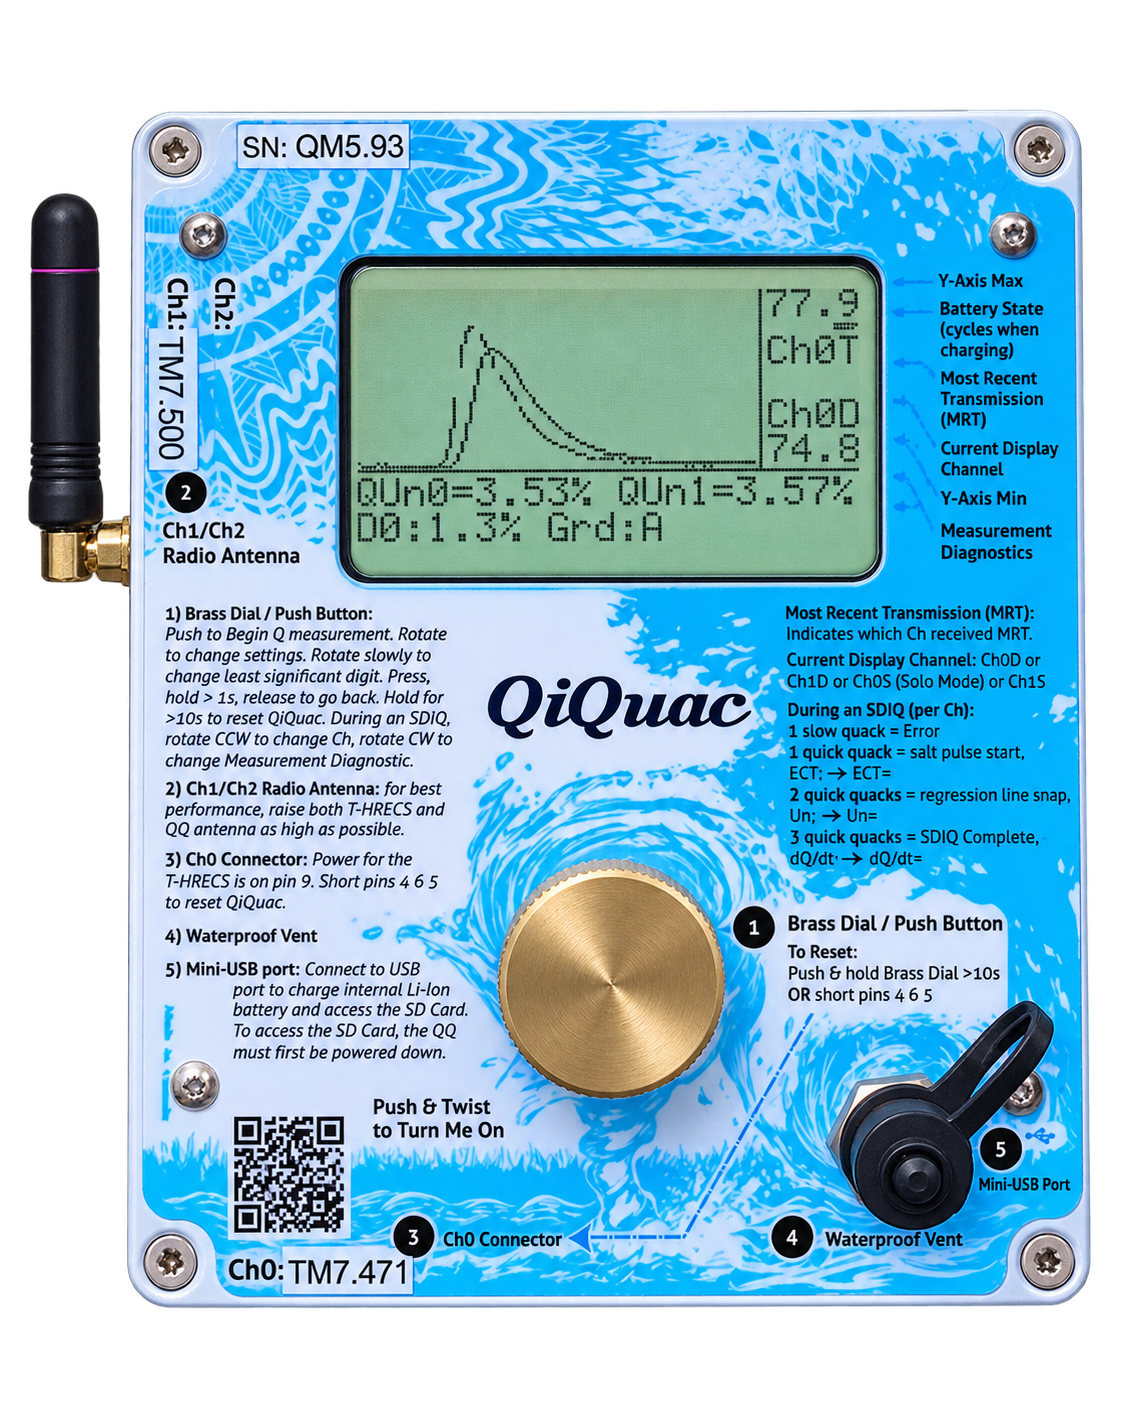
QiQuac
Rapid post-processing of Salt Dilution measurements from the QiQuac kit. Group, Grade, and Export your measurements, and see where your points fall on the rating curve.

AutoSalt
The AutoQAc / AutoSalt system: manage salt dilution measurements, build a rating curve, and monitor AutoSalt time series data.