I’ve been meaning to put together a photo gallery of installations. So here it is (if the stand looks off-kilter, it’s just the photographer and not the stand). Please note that Rating Curves have not been developed for all sites. Where RCs are presented, they are the most recent RC from the Salt Portal, and may contain only a few days of data, or a few years. Where multiple rating curves have been developed over time, a more elaborate figure is presented. All sites are a bit different and we will work with you to find the best solution for your site, including finding a local supplier of tank and the best telemetry solution.
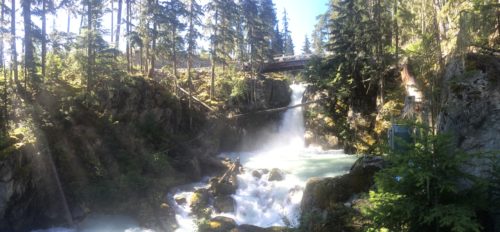
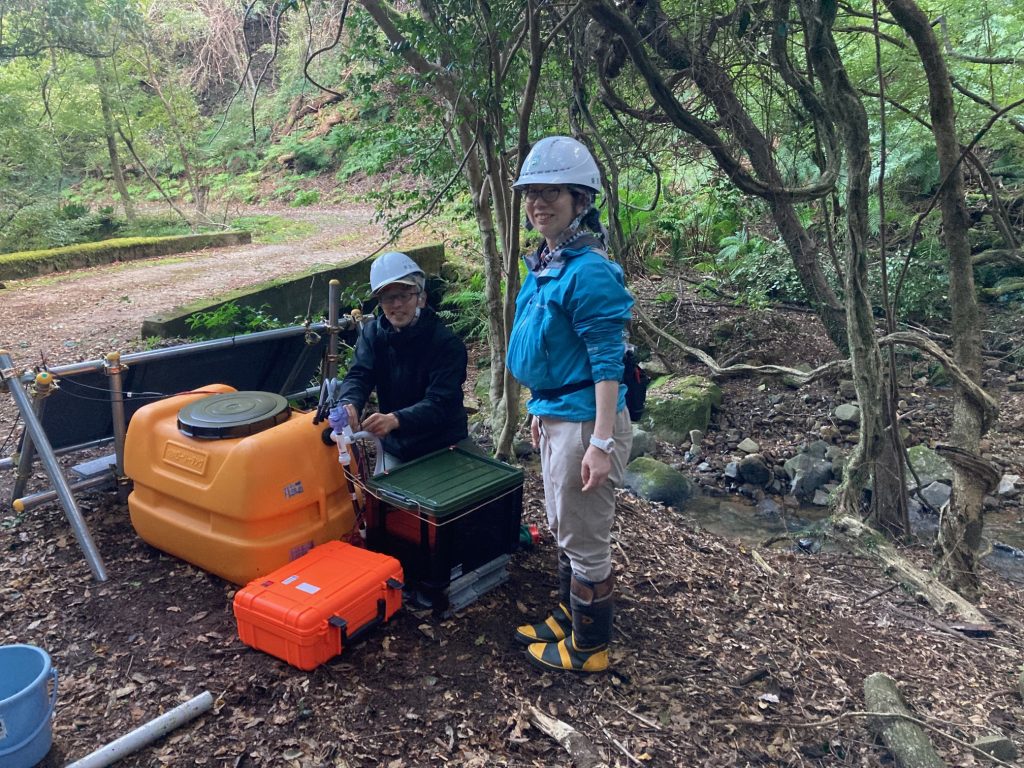
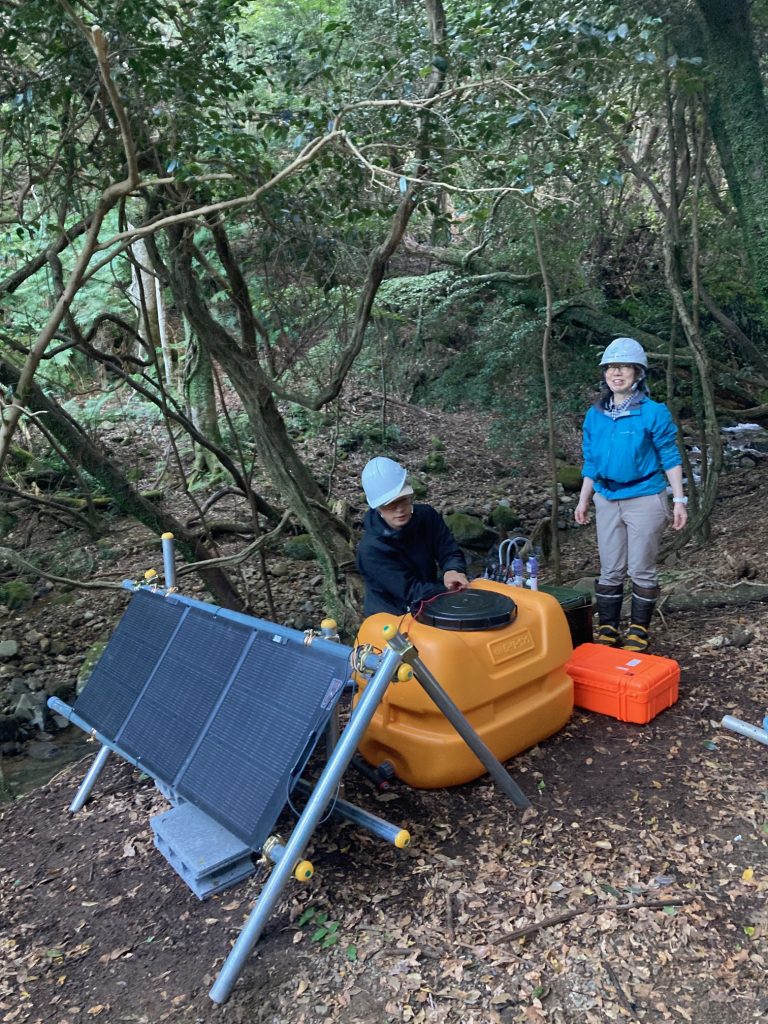
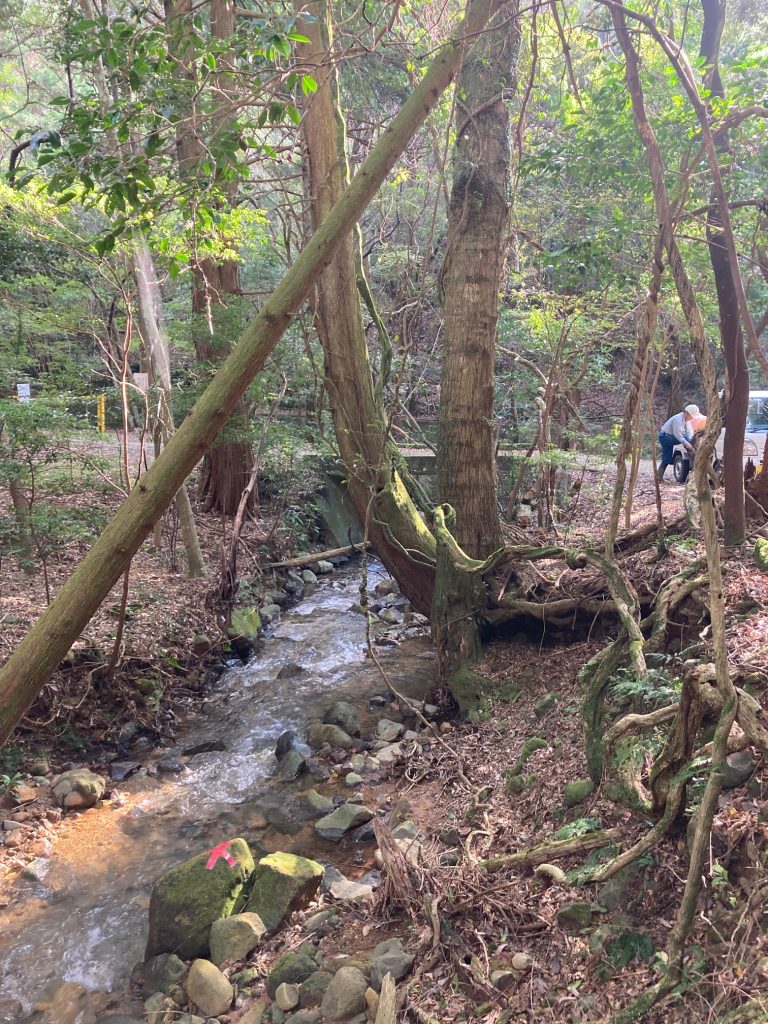
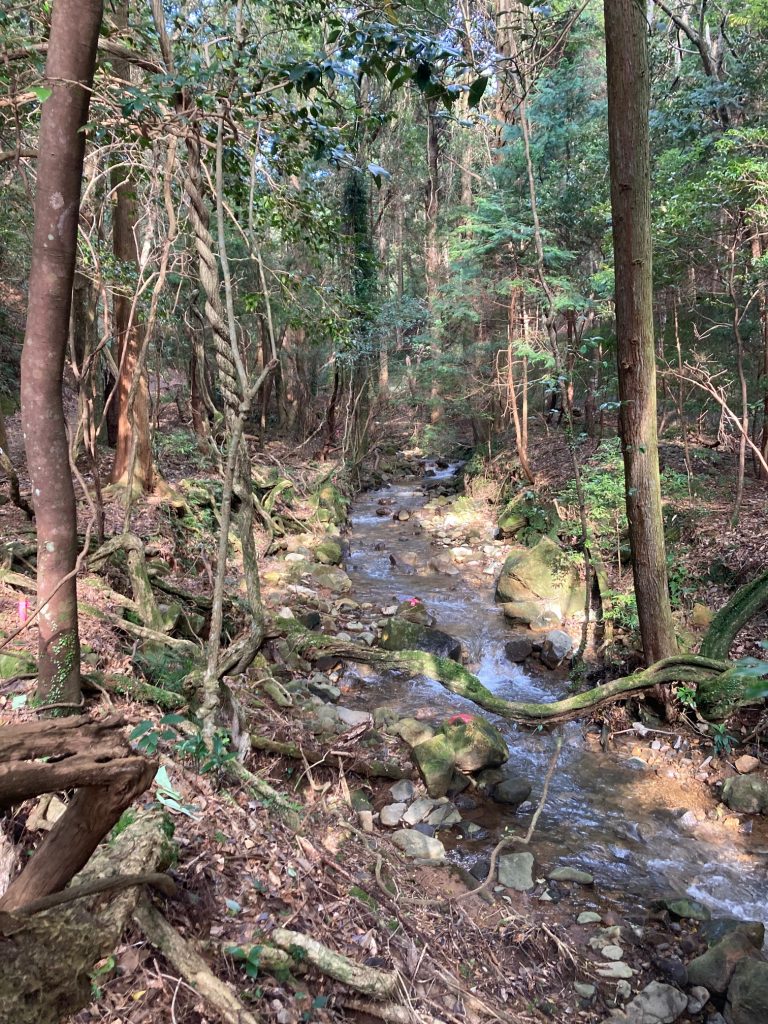
Aonogawa in Chichibu Research Forest on Izu Peninsula, Japan (Nov 2024)
With the assistance of Maeda-san and Yuko-san, we installed Satoyama Energy’s recently purchased AutoSalt in the beautiful Chichibu research forest on loan to the University of Tokyo. This system is “Off the Grid” so no measurements to show until the next site visit.
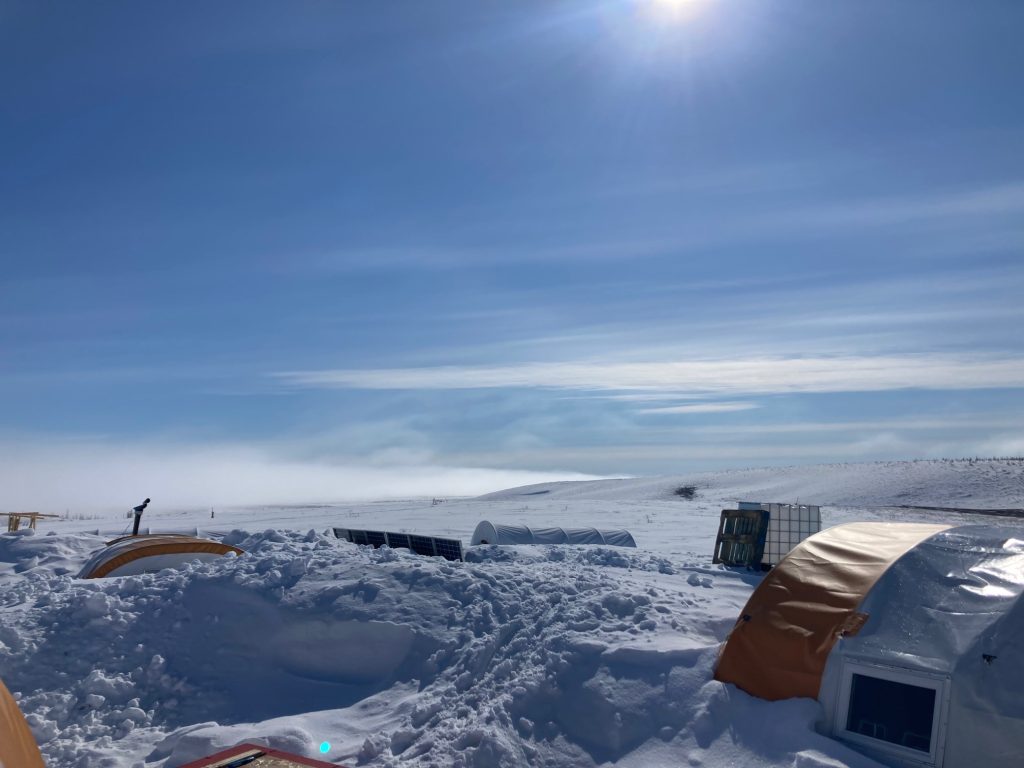
McKeand River, Near Iqaluit, Nunavut (Sep 2024)
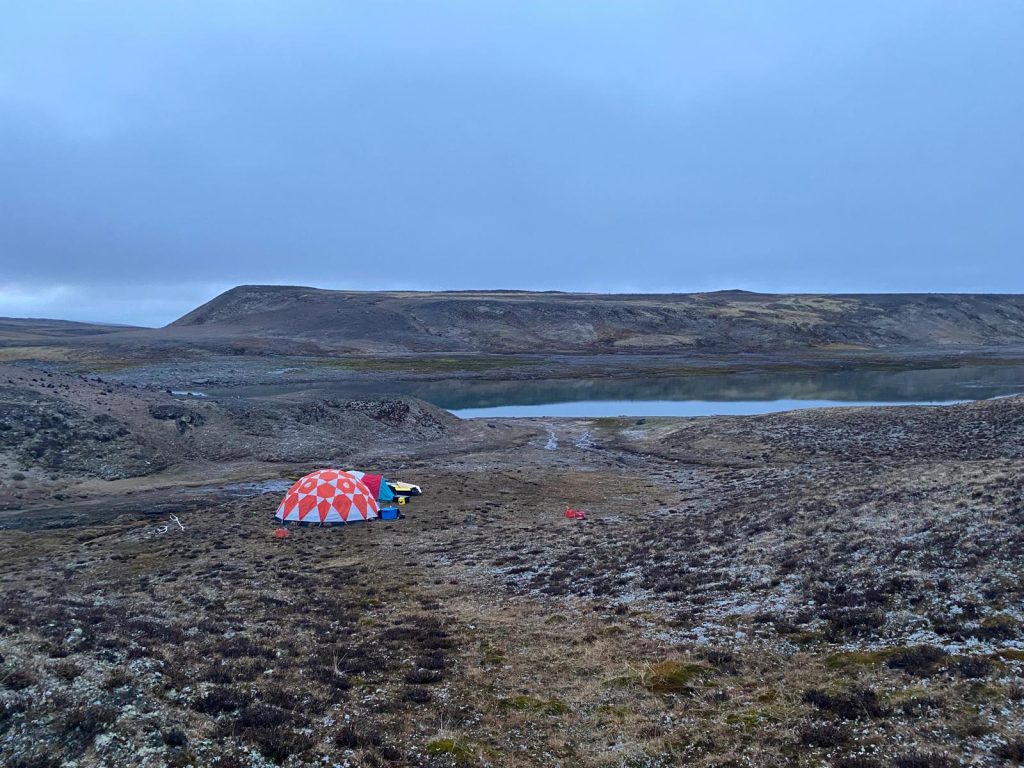
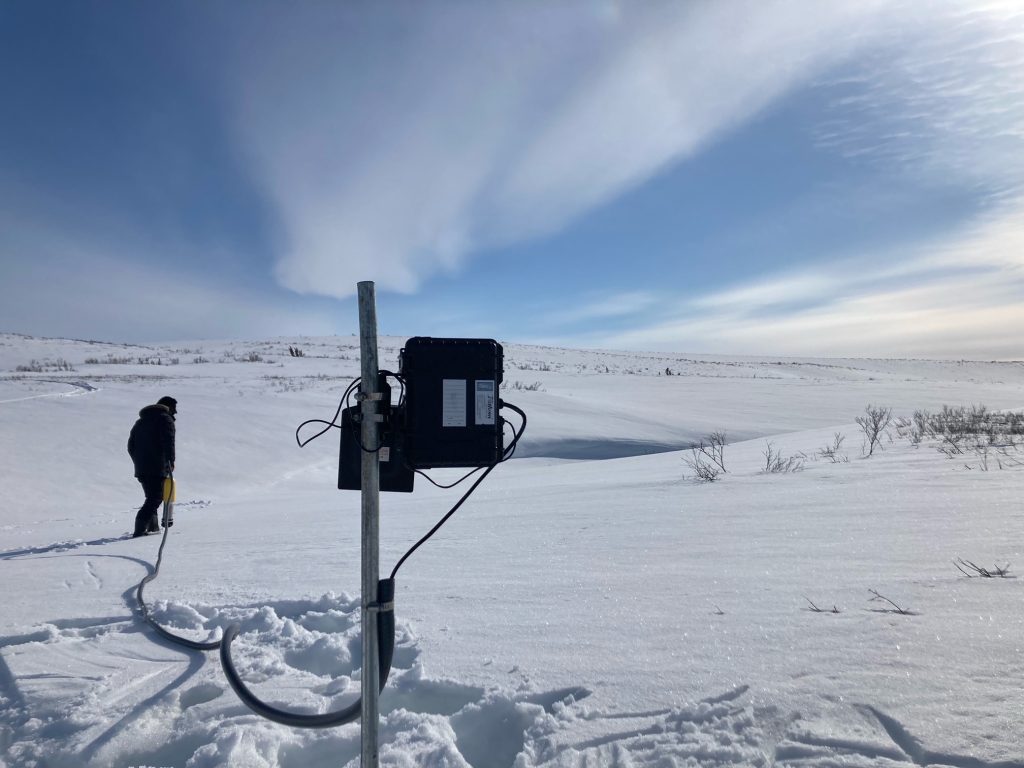
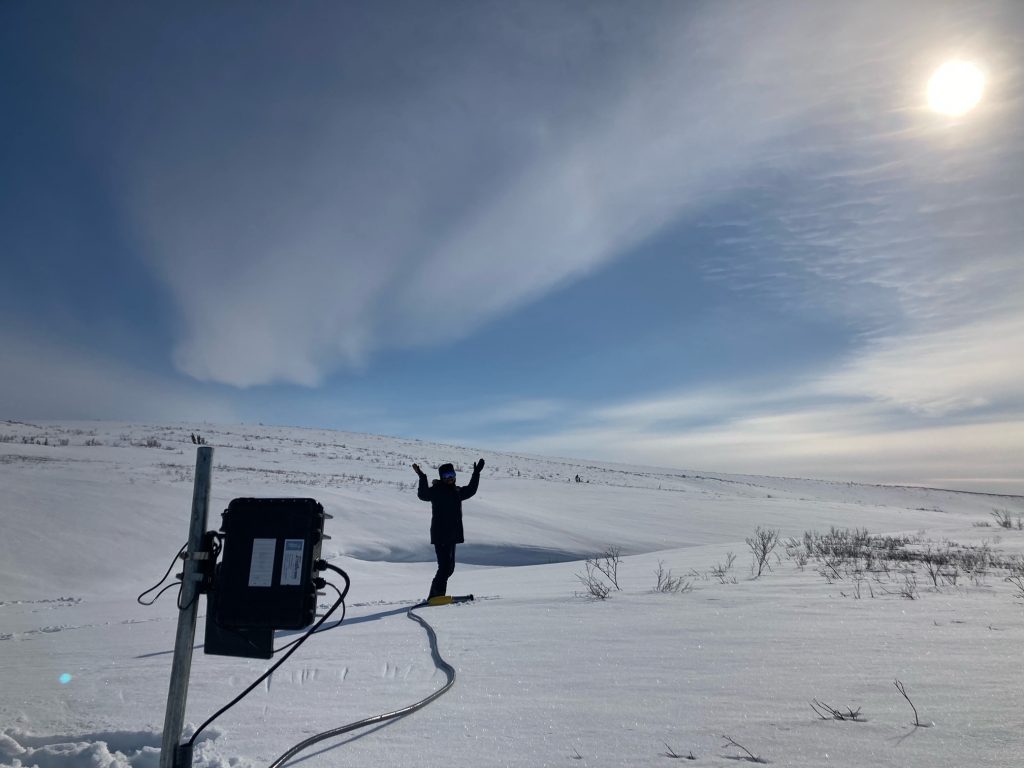
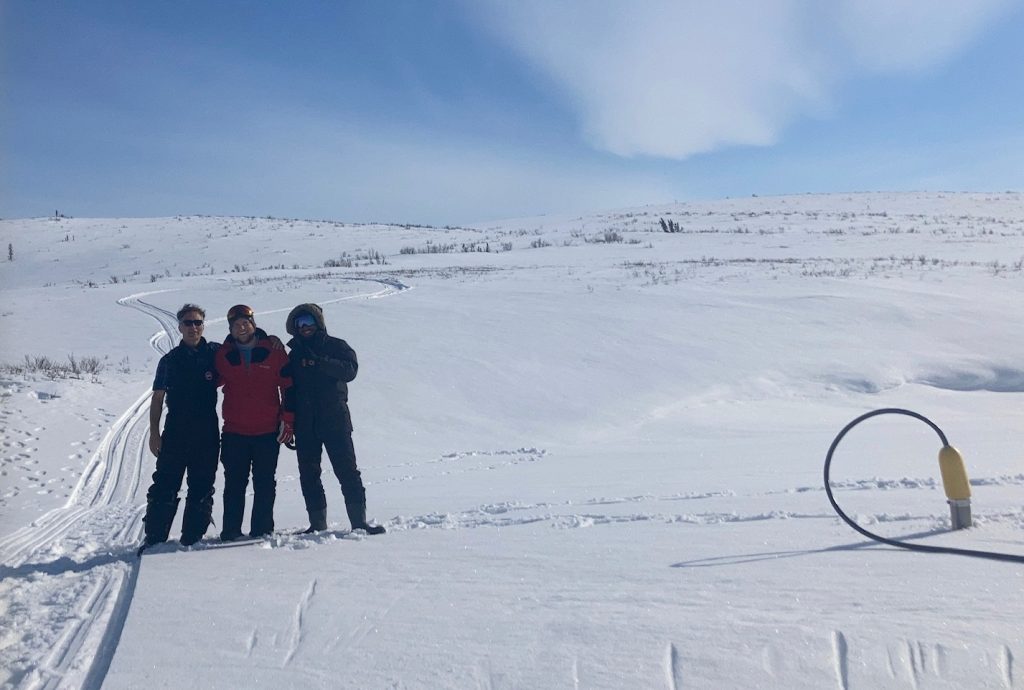
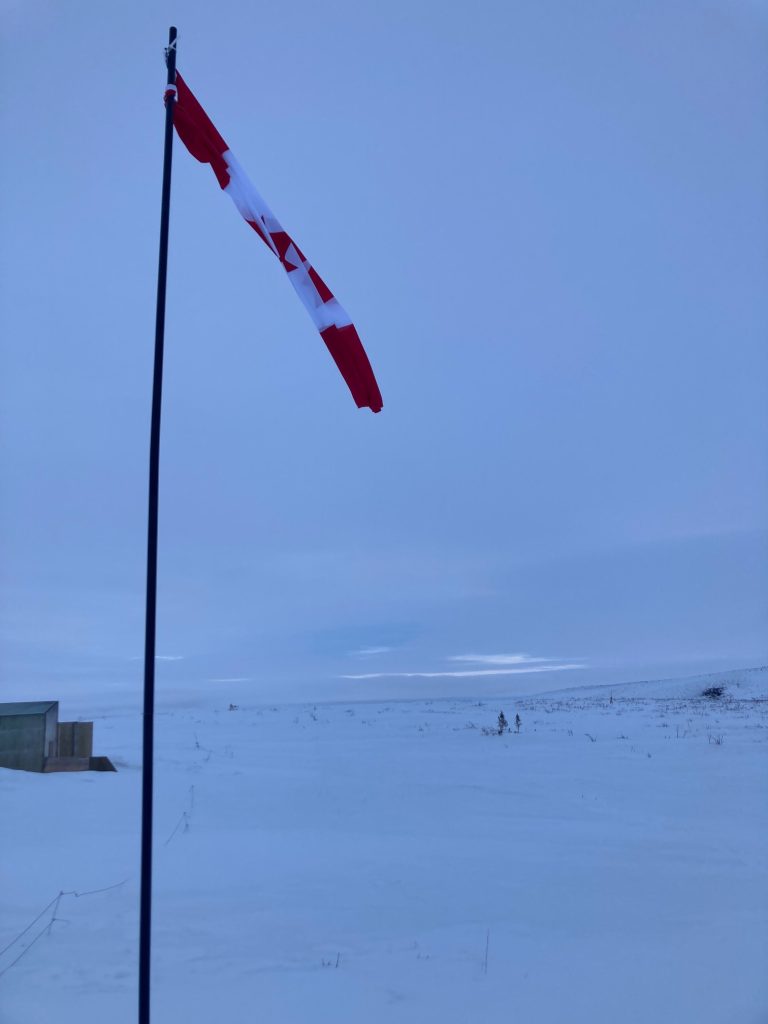
Another otherwordly adventure in Nunavut. This time to install two Big Freakin’ Flow (BFF) Auto-Salt Systems (ASS) for a potential hydropower project near Iqaluit, Nunavut. Each system consists of a coupled 300+1000 Litre tank with 20% Brine, for a total of 260kg of salt ready to inject. We are aiming to measure up to 500 m
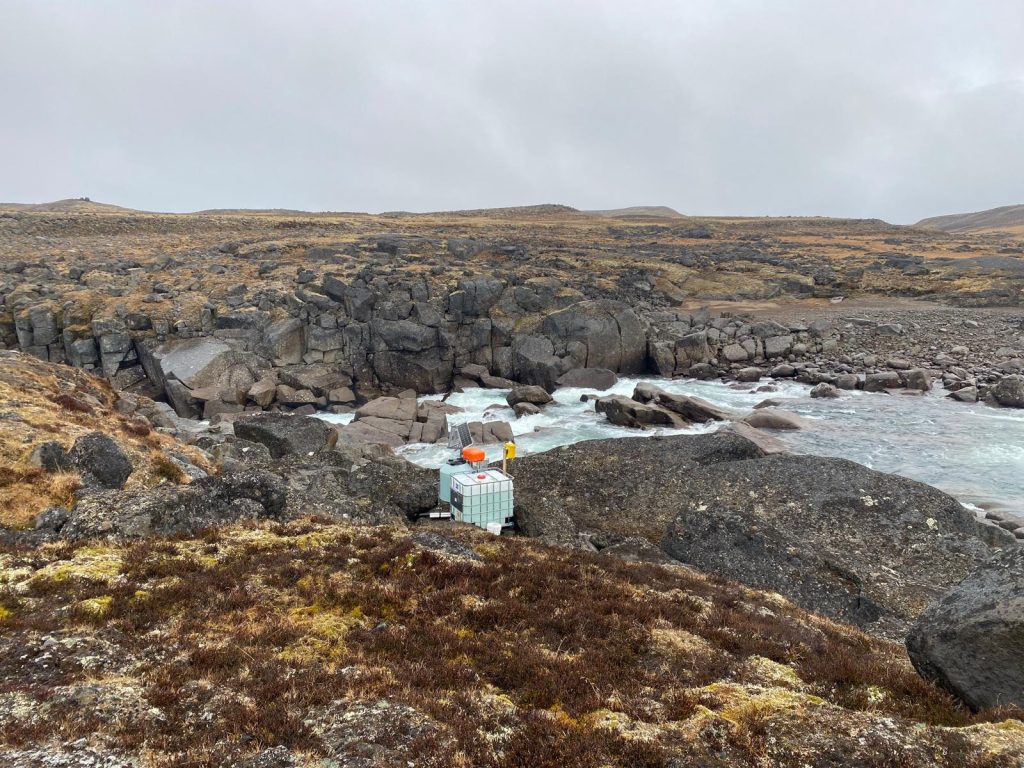
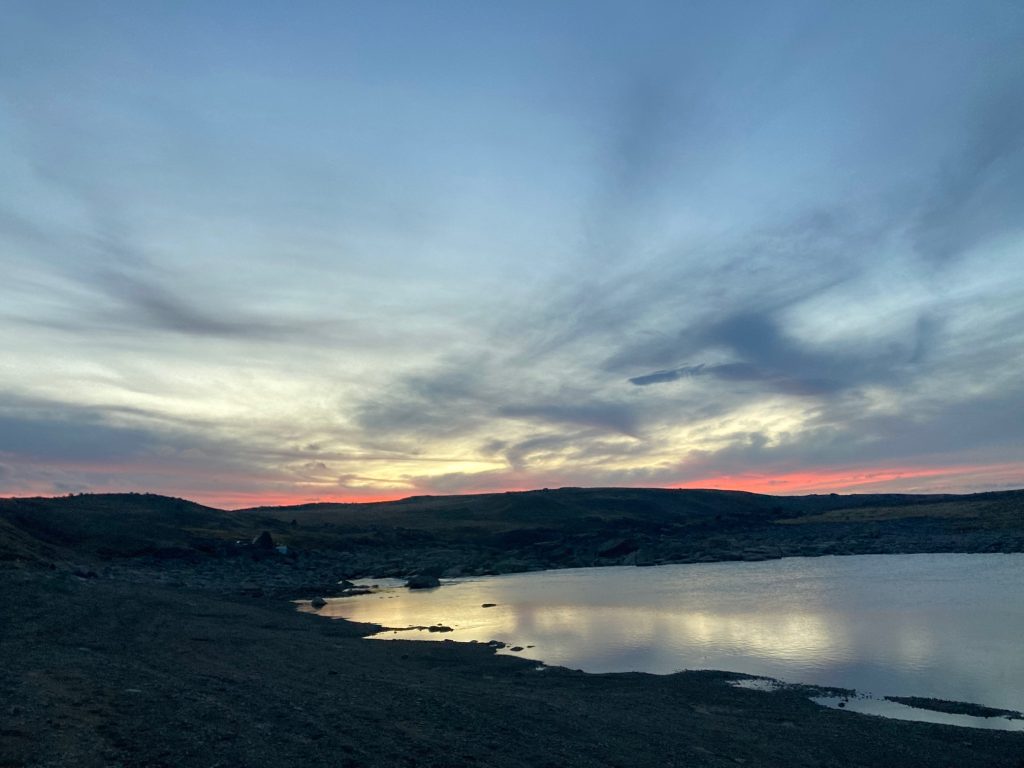
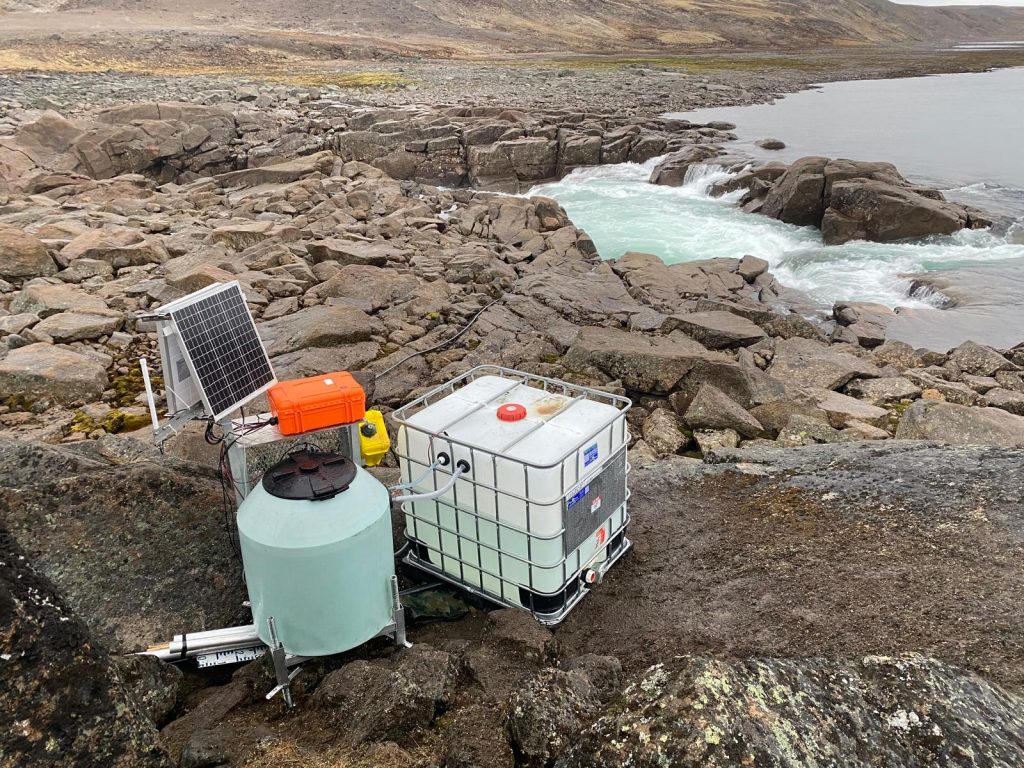
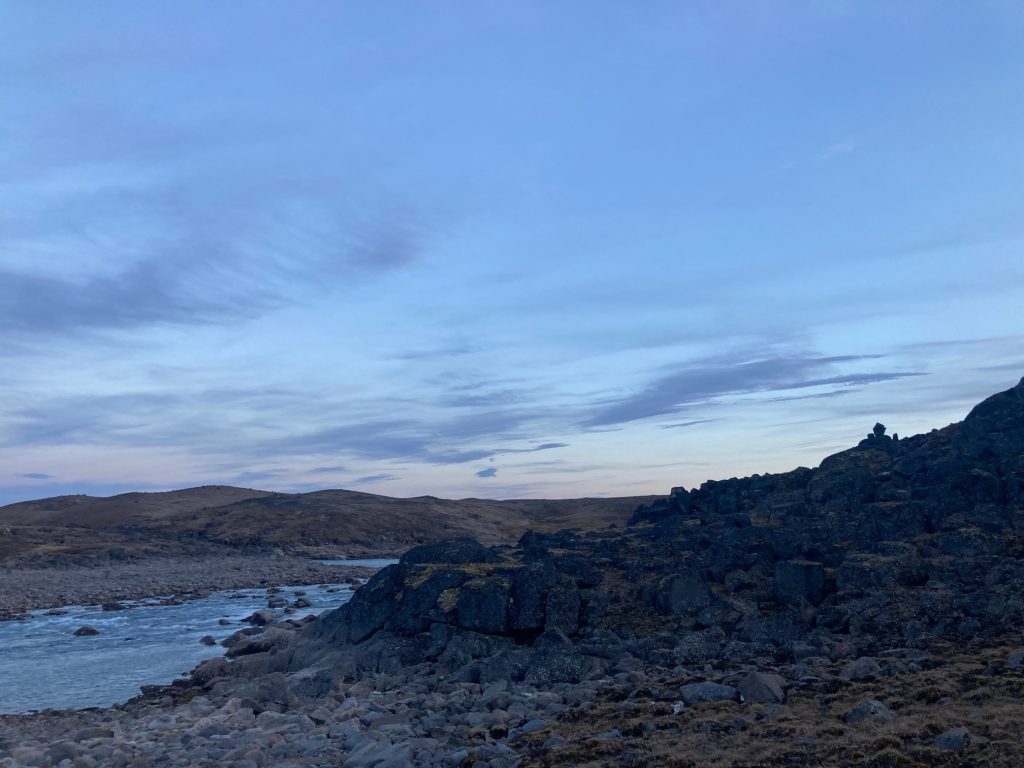


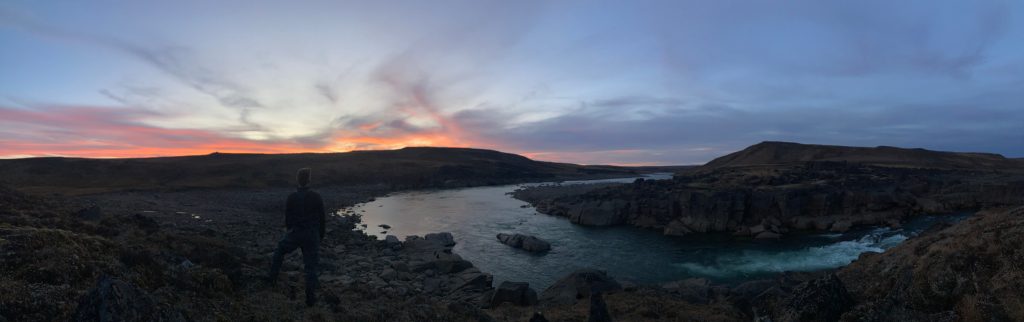
This landscape was so amazing: part Lord of the Rings (the books, not the movie) and part Mars Terraforming., every photo deserved a panorama. Greens and brown and yellows, horizons punctuated with basalt blocks. So much land, so few people. We’ve only been able to process a few measurements so far, and shockingly, as little as 5 kg was seen two kms downstream and the SDIQ agreed with the injection measured only 300m downstream.


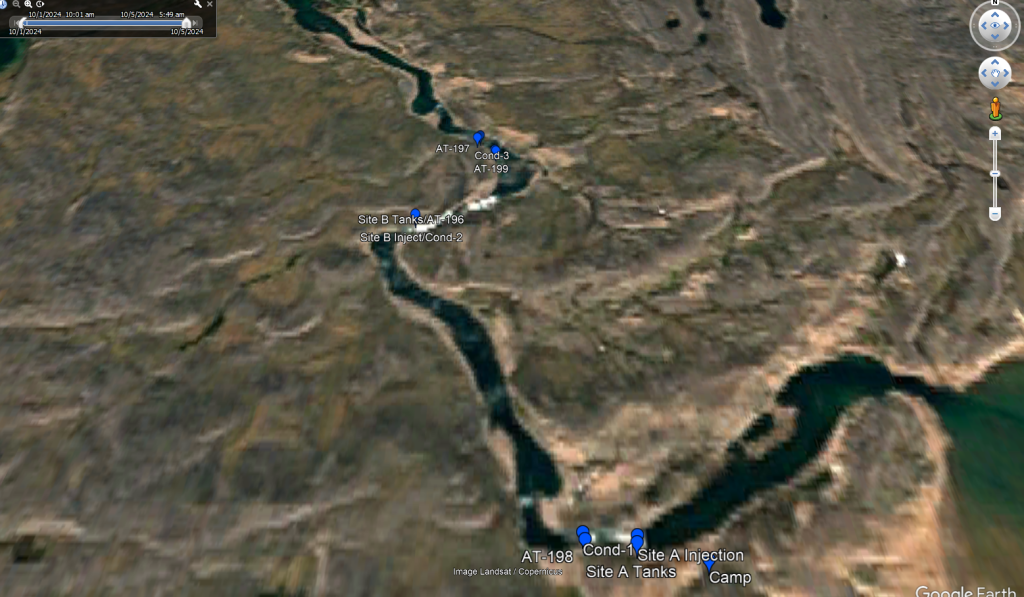


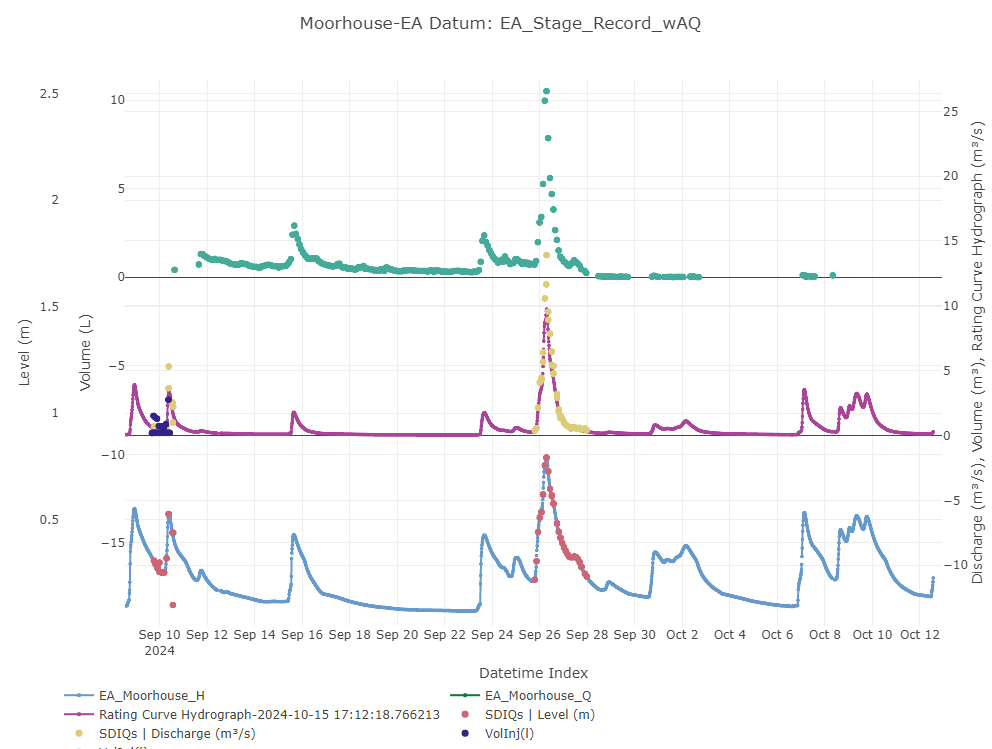
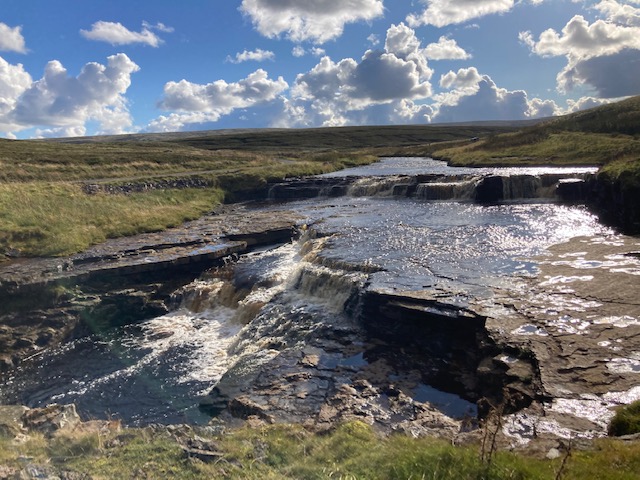
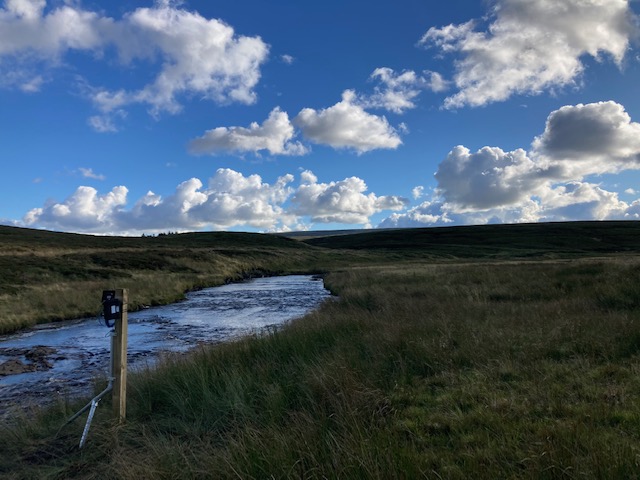
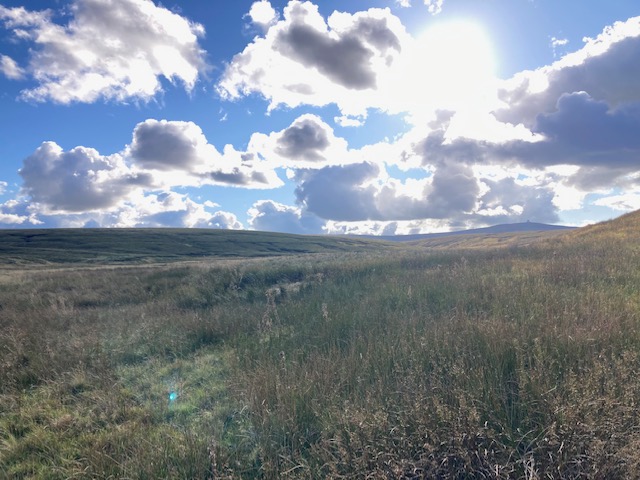
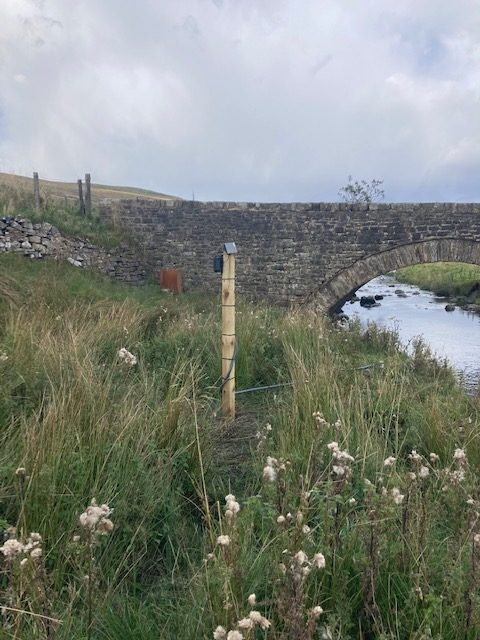
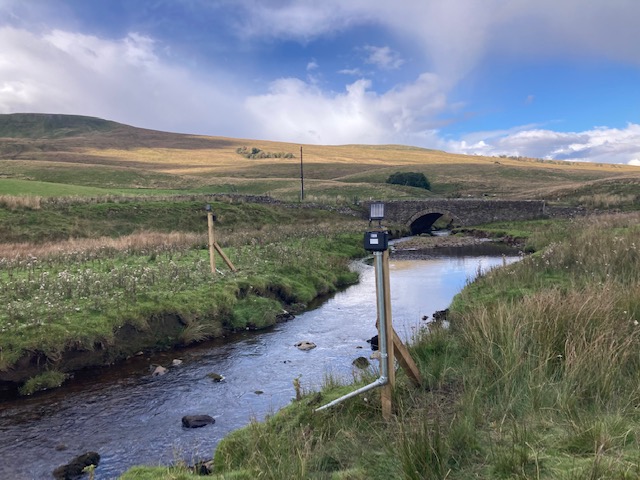
Moor House UK EA Station, (Sep 2024)
About 2 hours north of Reading in the Dales is Moor house. “Beware the Moors!” they whispered to Sherlock. This UK EA station has been notoriously difficult to get to for large flow event, recording a maximum of 8 cms in over 30 years of record. The AutoSalt recorded a full storm event up to 10 cms in the course of 1 month.


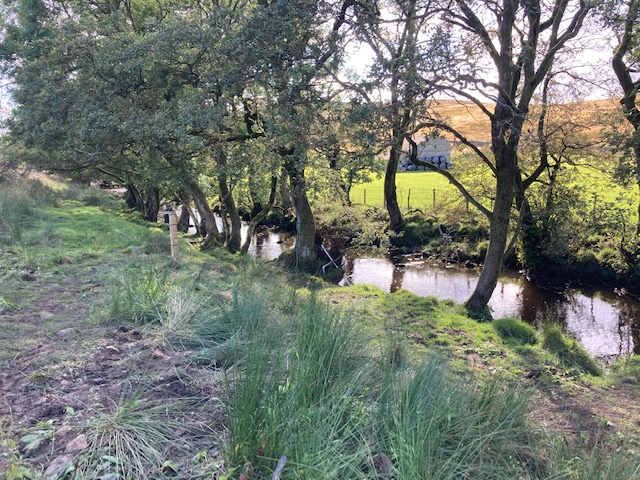
Low Houses UK EA Station (Sept 2024)
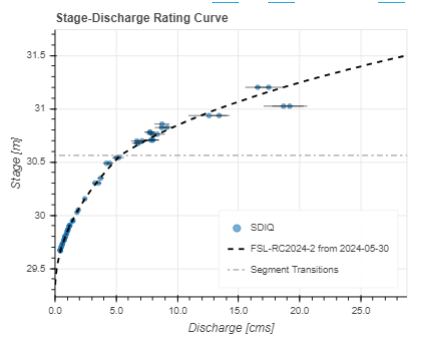
After installing Moorhouse, we went to Low Houses in the Yorkshires. This is large flat reach, but amazingly the reach achieves complete mixing. There is evidence of hysteresis at this site (velocities increase first before the water level rises at the gauge). This is indicated by the larger Q for the same water level on the rising limb as the falling limb. Ignore the Qs of 1.0 and water levels of 0.1; they are upstream probe data.


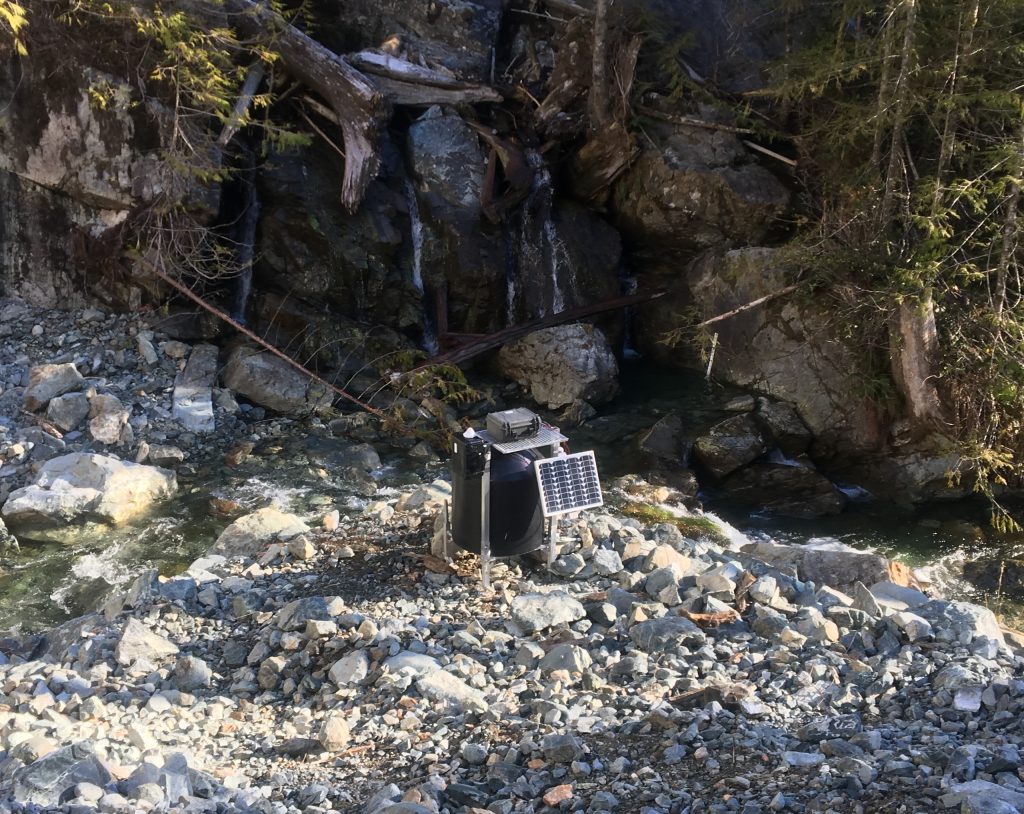
Trail Valley Creek, Near Inuvik NorthWestTerritories (May 2024)


I helped Arnab Singh install an AutoSalt on loan from WSC in April at the Trail Valley Creek Research Station. After some hiccups, 71 measurements have been made with an average error of 5.8% for a Grade A rating. There was no creek when we installed it.
Rouziguiaou Creek in Brittany, France (April 2024)

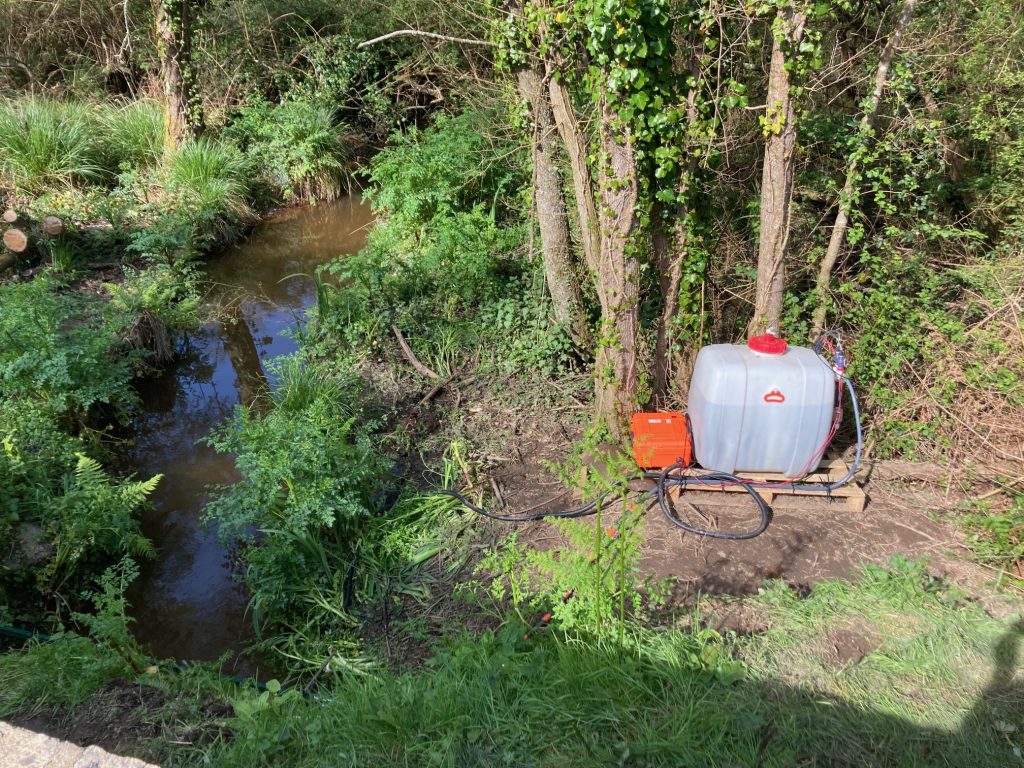
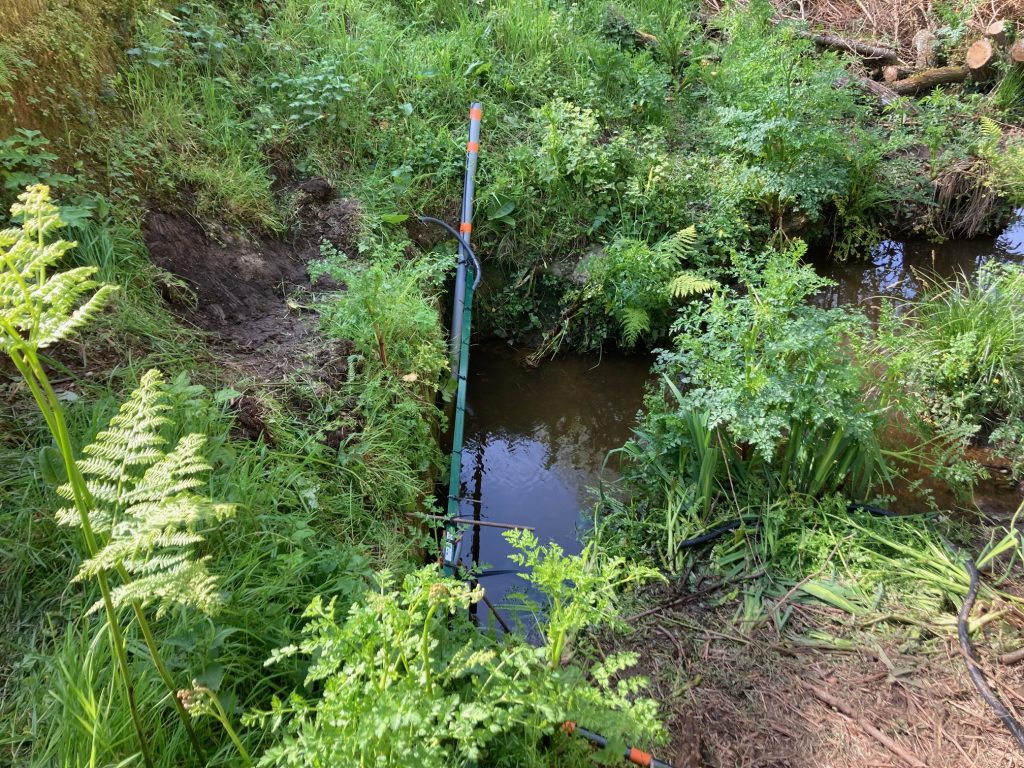


This site was quite startling when I arrived. “You do know that salt dilution requires mixing to work, right?” The site is essentially a marshland, however there is an upstream culvert which contains all the flow. We positioned 3 AT units downstream, about 10m only, equally spaced across the channel. The real innovation here is an injection pipe with holes spaced approximately proportional to the flow beneath each flow. This is a way of “pre-mixing” the brine across the channel. Once this was done, we were getting fairly good agreement between the three probes. Even when not completely mixed, the QComp should give a good estimate of Flow.
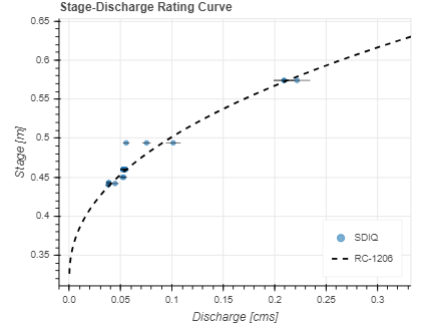
Heltondale in Cumbria, UK (Jul-Oct 2023)
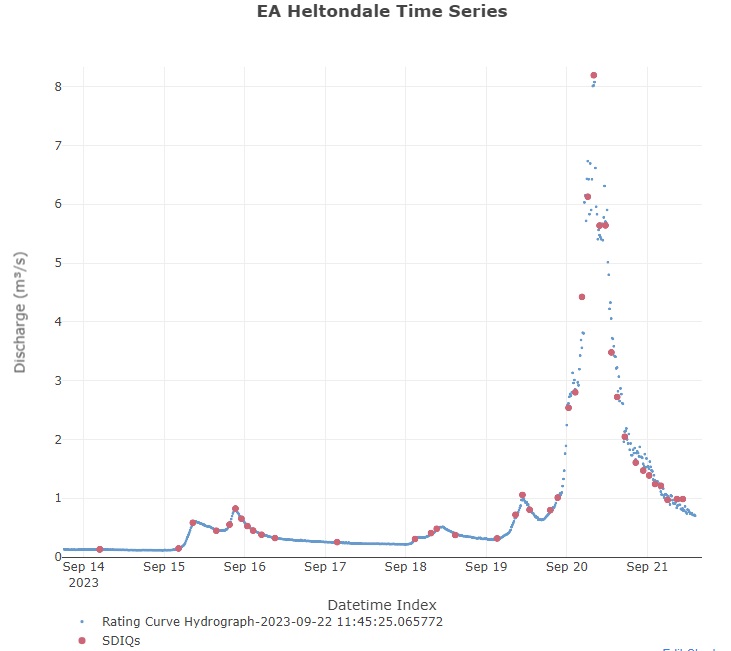


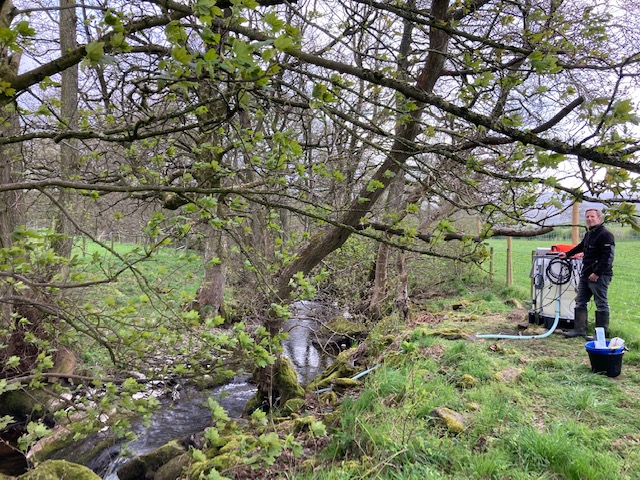

The Heltondale AutoSalt for University of Lancaster, care of Nick Chappell, was slow to get started (installed in May 2023) after several failed Boost converters for the PicoMag (needs 20V) and weird Teltonika firmware issues, it was off to the races in September. It captured a large event in Sep 2023 and has been working flawlessly (more-or-less) since then capturing 208 measurements with an average uncertainty of 6.5% for a Grade A.
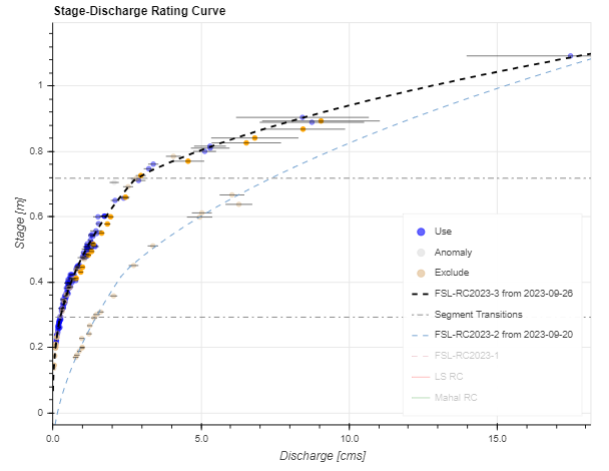
Olen Creek in Italian Alps, Italy (Sep-Oct 2023)
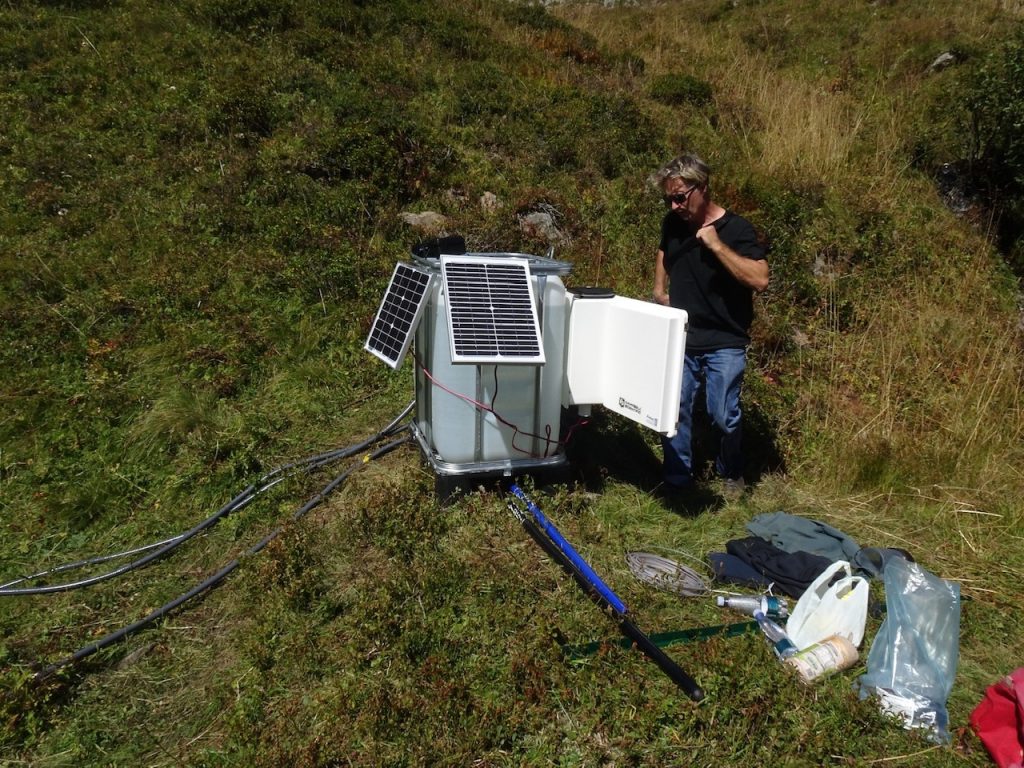
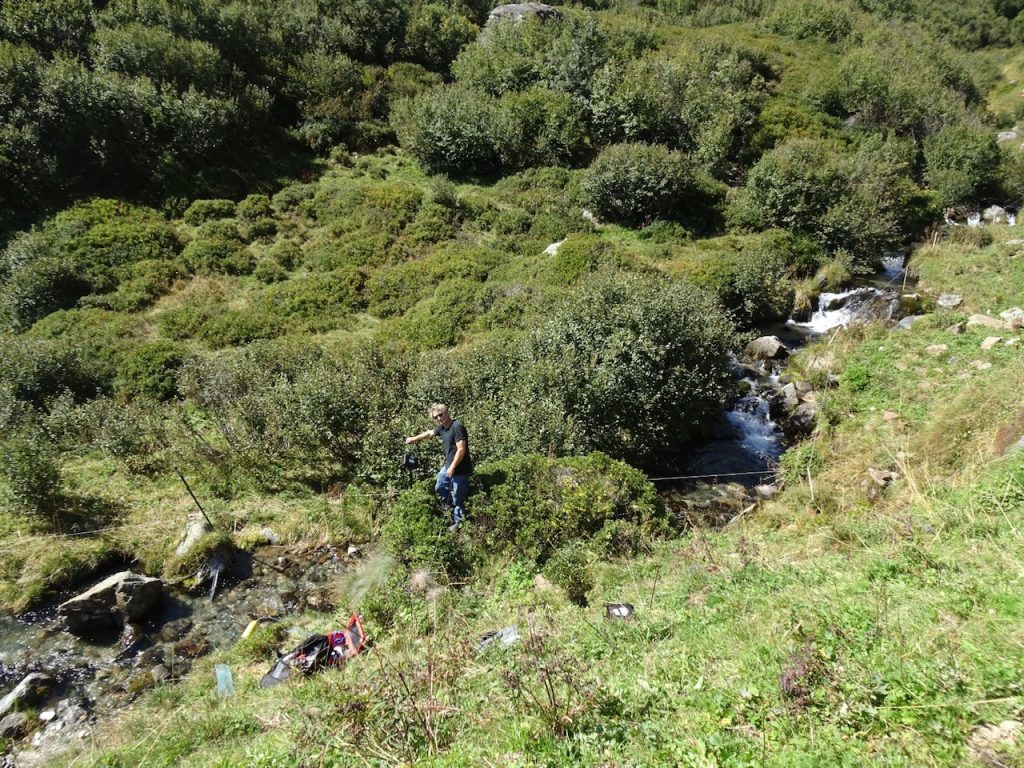

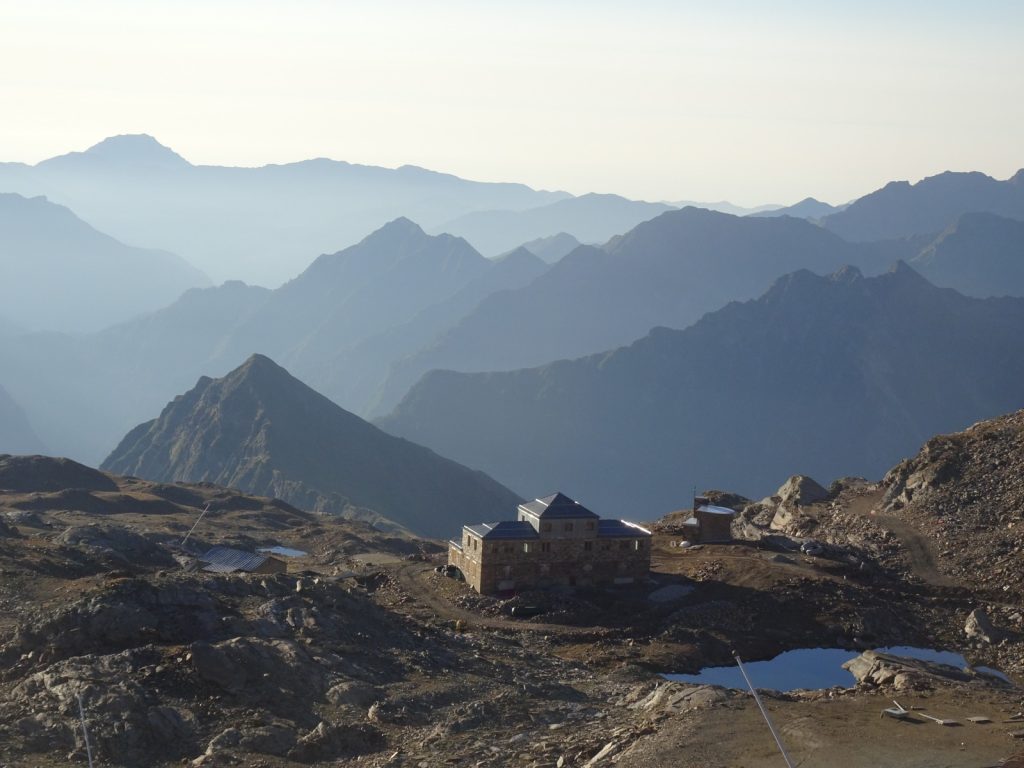
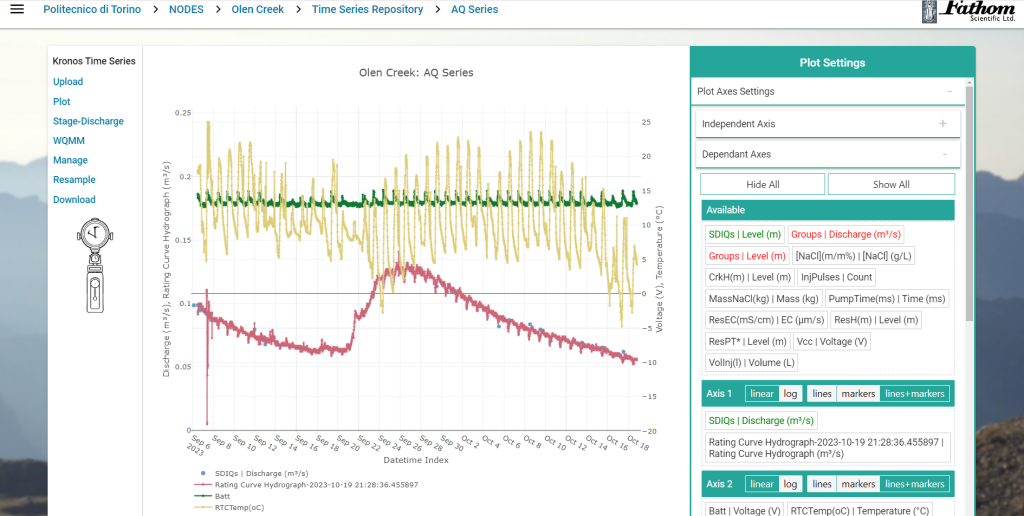

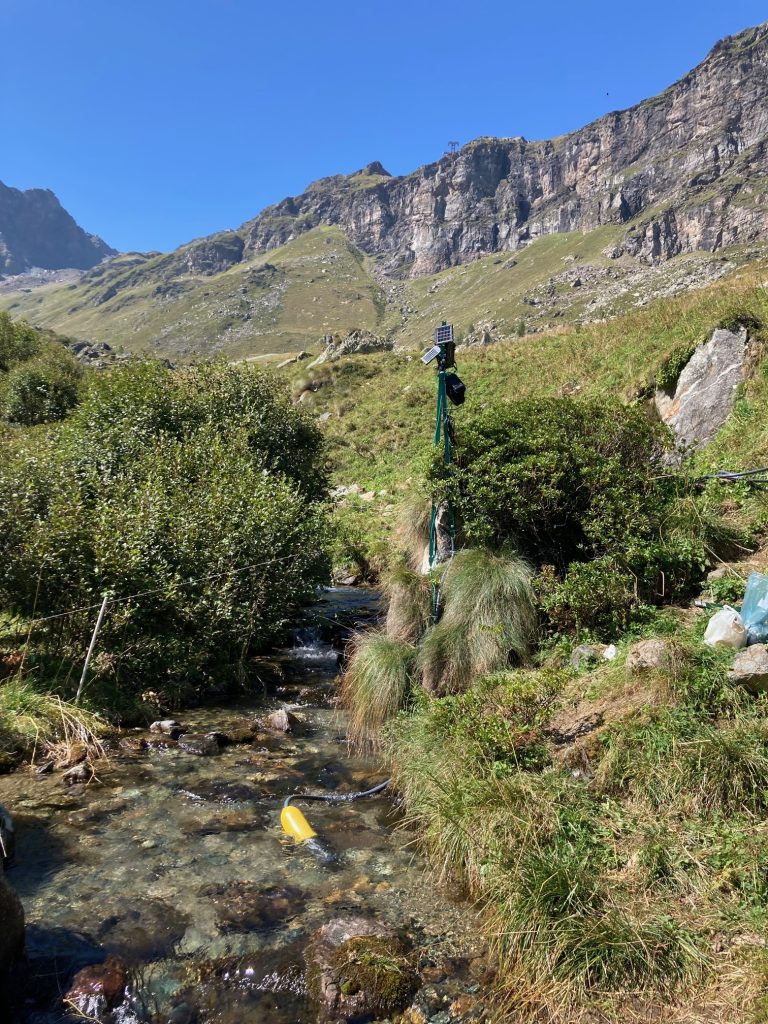
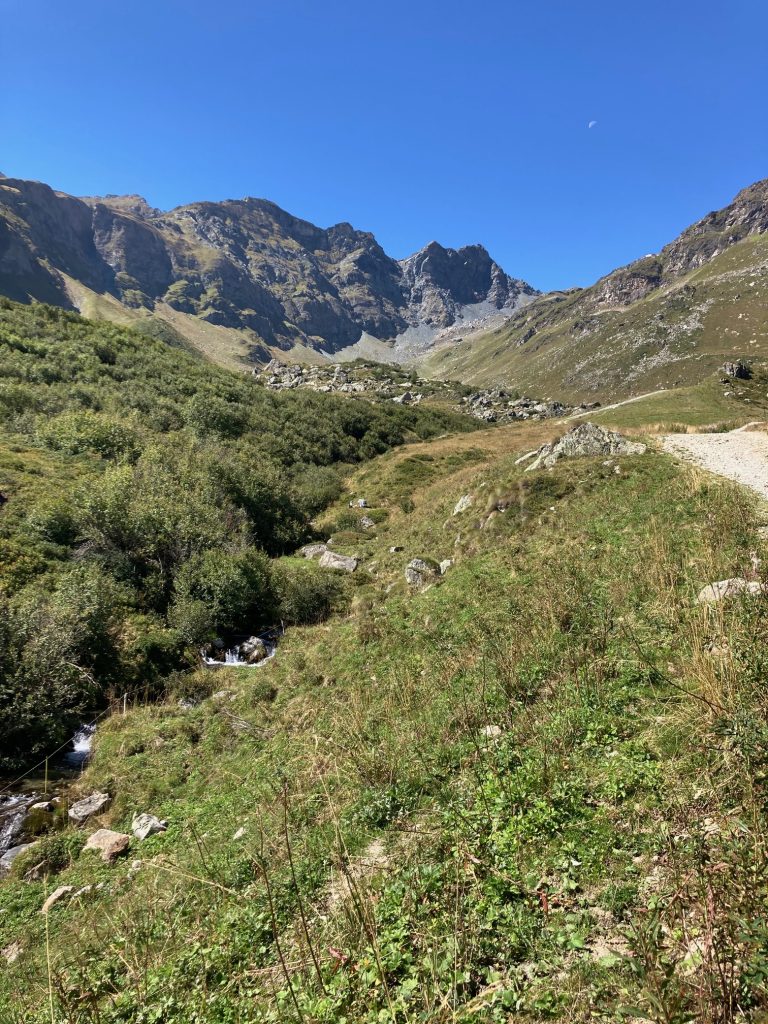
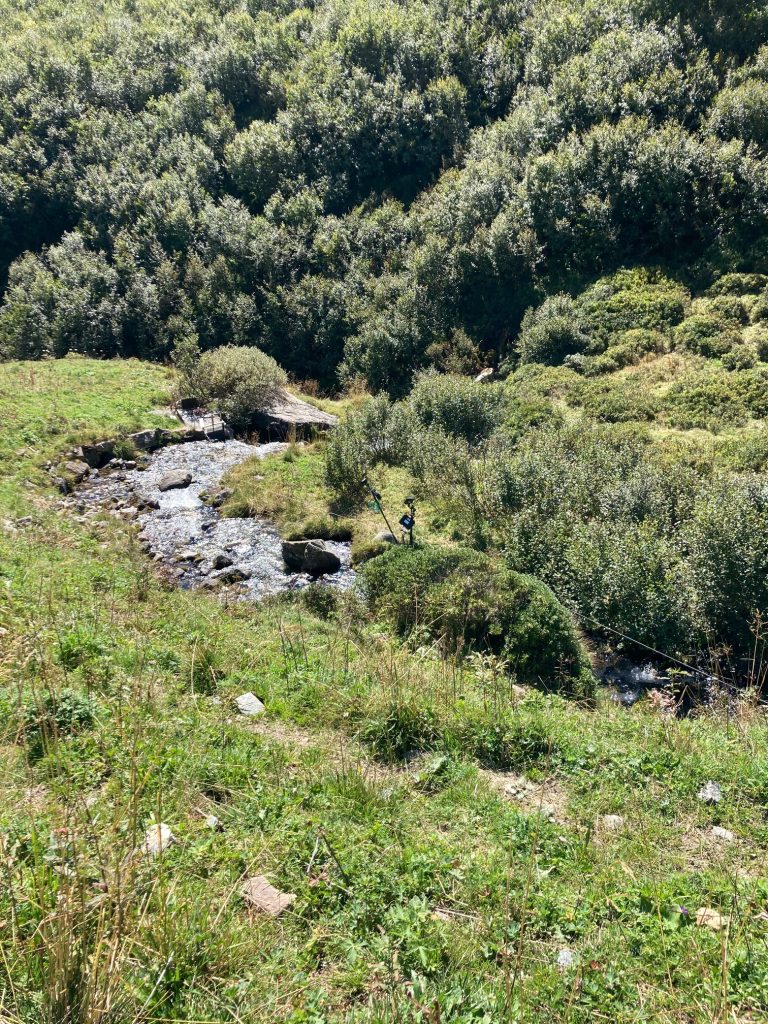
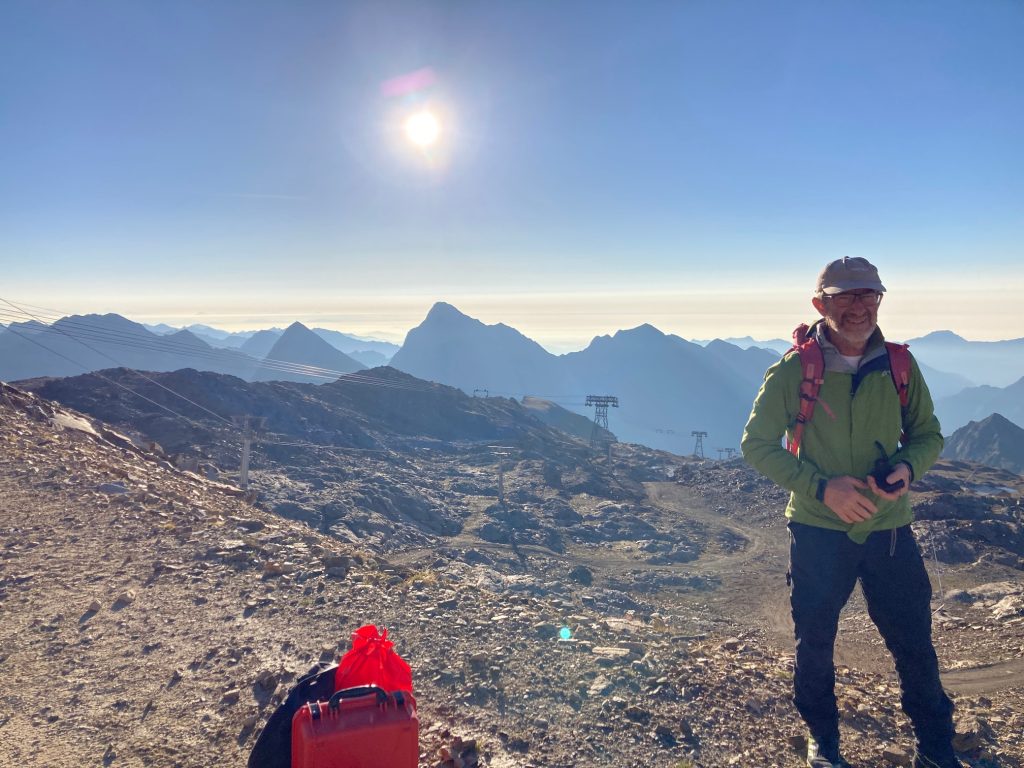
I had the distinct pleasure of meeting Stefano Ferraris and tromping through the alps north of Turin for the Politecnico di Torino’s AutoSalt installation on Olen Creek. 31 measurement so far with excellent solar charging. The range of flows is currently small however. Excited to see how this unit performs over the winter.
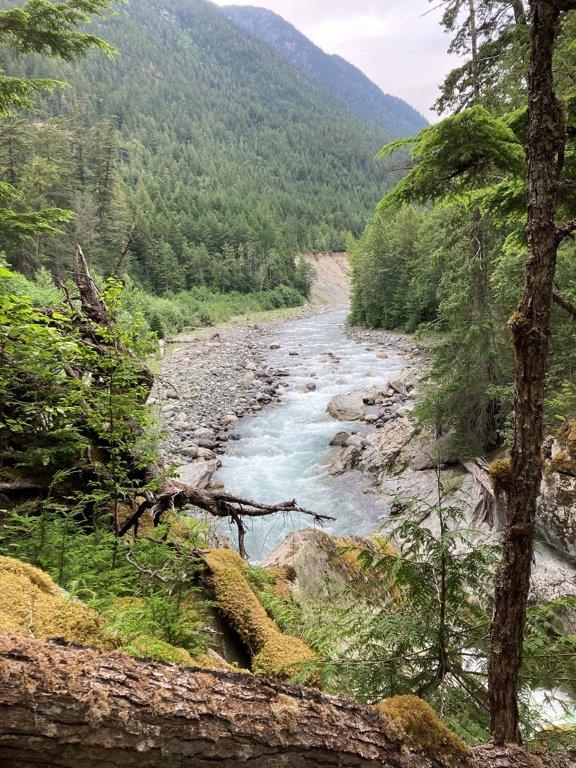
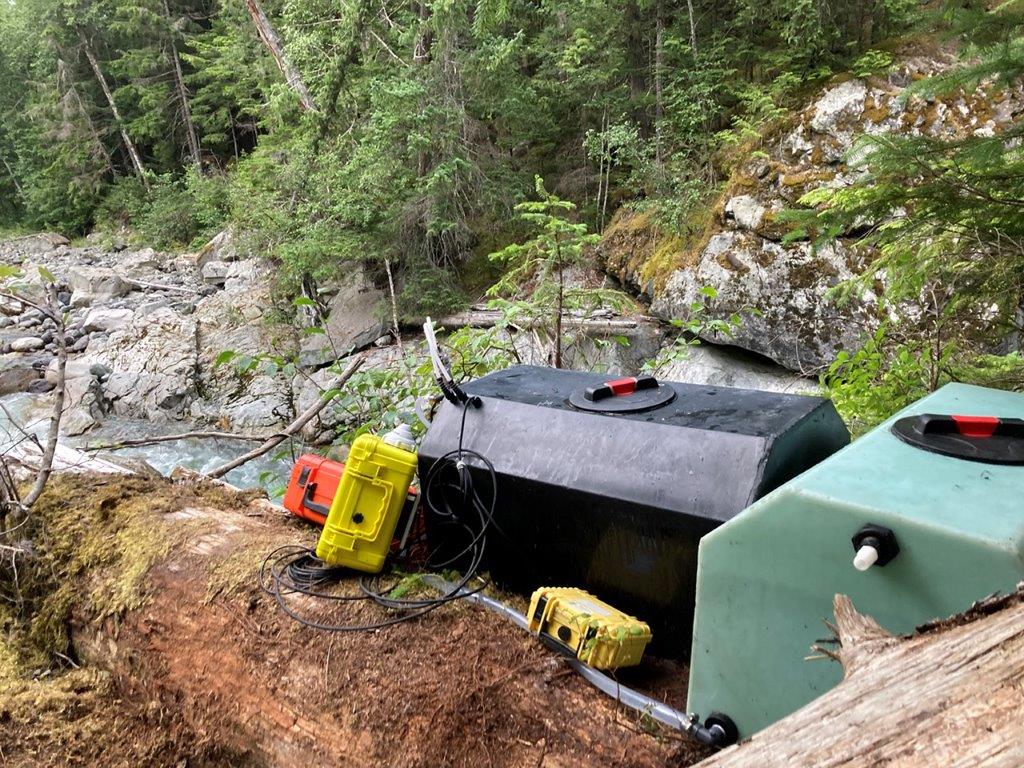
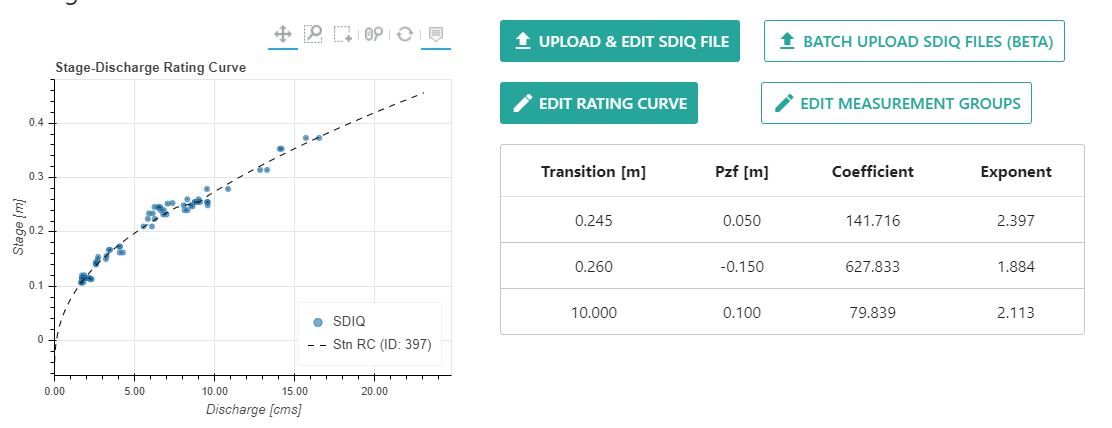
Wedgemount Creek near Whistler, B.C. (2021-2023)
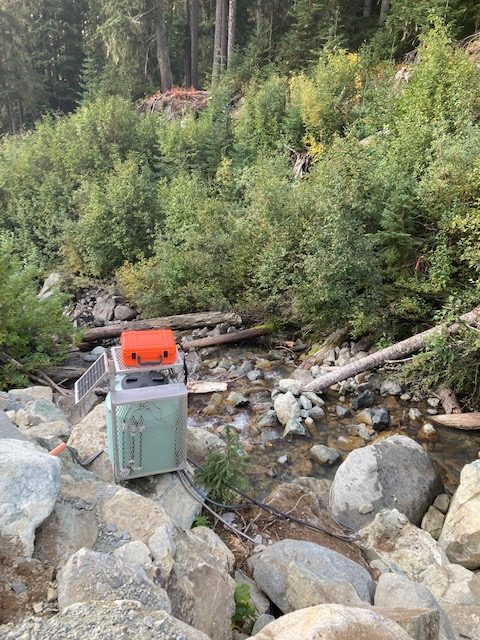
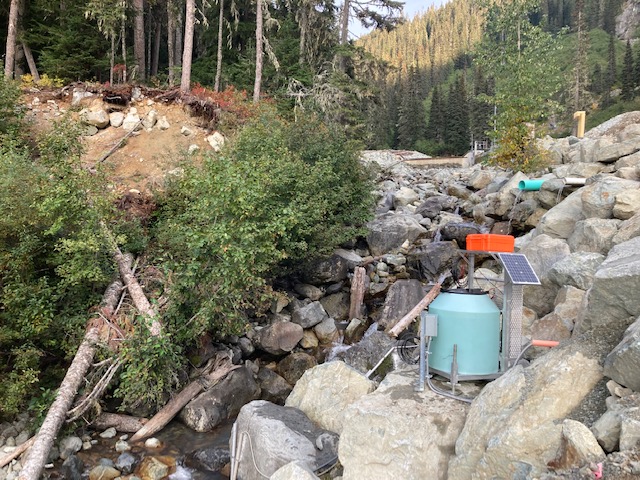
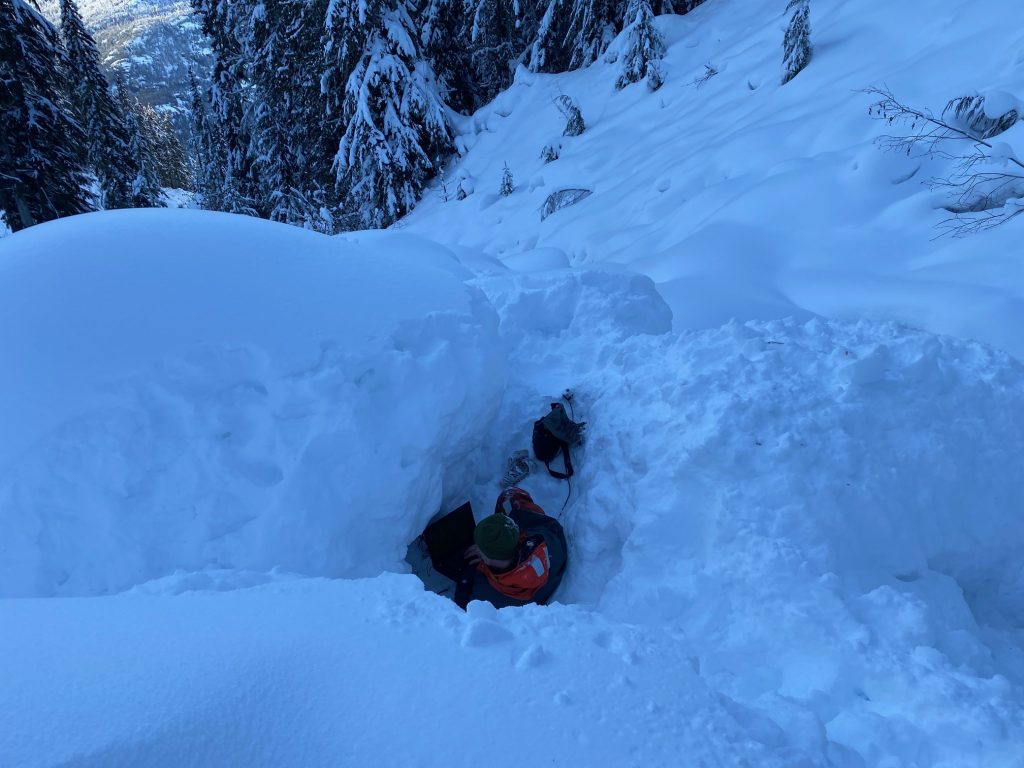


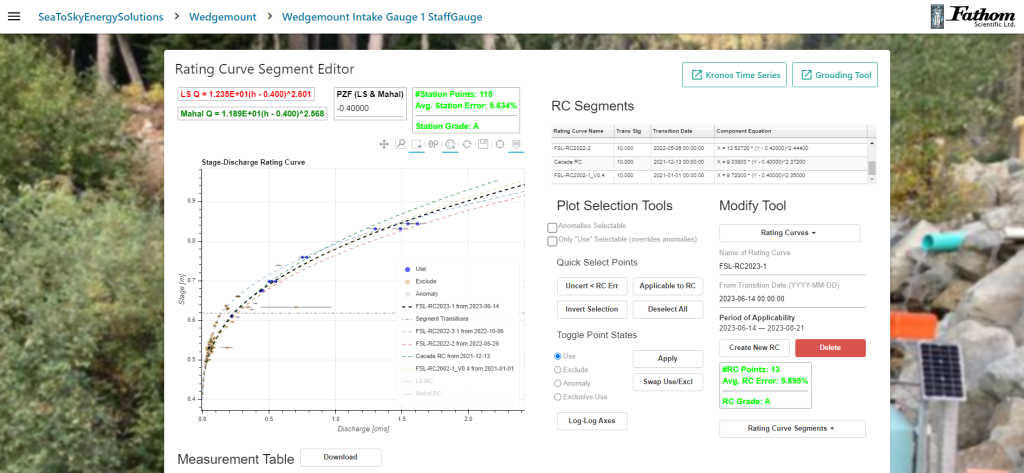
The Wedgemount Creek Intake AutoSalt is used to monitor flows downstream of the hydropower intake. The hydraulic control is very unstable, typical of high mountain streams, so the rating curve changes often. This system worked throughout the winter when it was buried in 6ft of snow, even the LoRa telemetry. The 20% brine stays fluid down until -20oC. While there have been 5 rating curves since installation in 2021, the average %Error is 5.6% with 115 SDIQs (left and right bank, so about 60 injections, unique stage-discharge pairs).
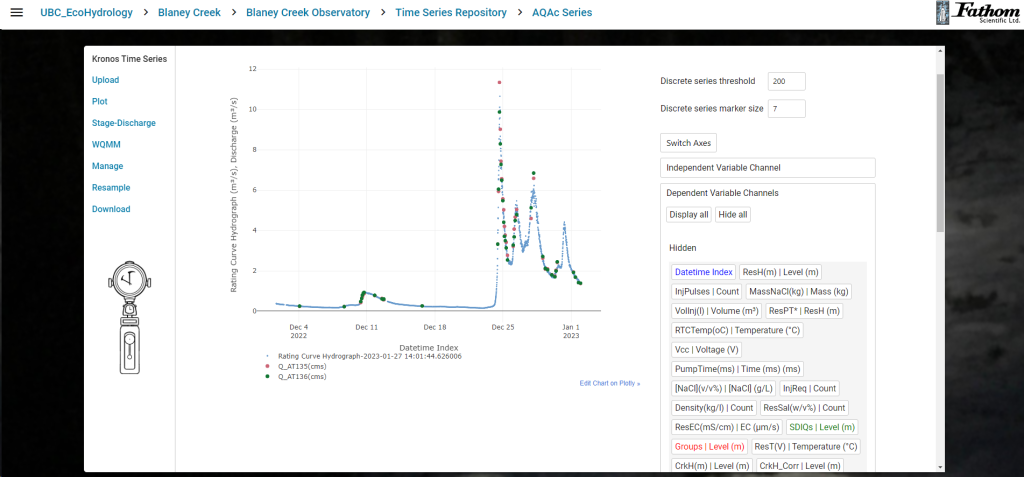
Blaney Creek in the UBC Malcolm Knapp Research Forest, B.C. Canada (Dec 2022)

The UBC Blaney Creek AutoSalt system is unique. It features wifi telemetry and 3 downstream monitoring stations, much like the Eskay Creek site, described below. Injections made at the upstream site can be measured at the three downstream locations, so long as they are not losing reaches (none are expected to be) since salt dilution will only measure increases in flow (increased dilution) moving downstream. So far the results are very promising, with 50 injections spanning the range from 0.183 m3/s to 10 m3/s. Because we know the distances between sites, we can also work out a channel reach Q-Velocity relationship. (TBD)


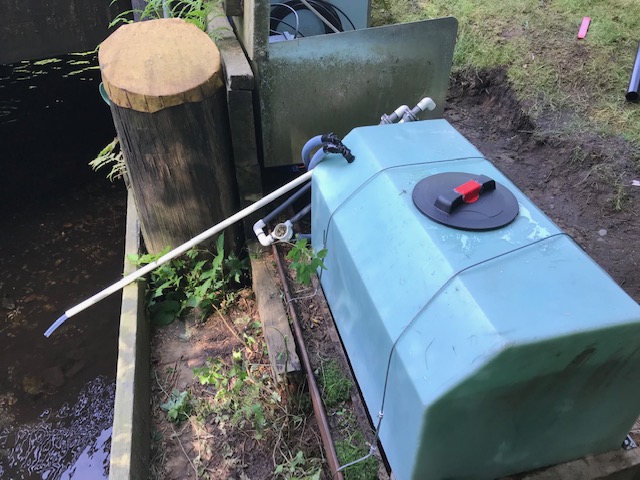
Noosgulch River near Bella Coola, B.C. Canada (March-July 2022)

We installed the “Backpack” version of the AutoSalt system on a rock ledge, just upstream of a very deep canyon. The canyon is 1km long and emerges near the bridge, shown in the bottom/right most photo. The aluminum pipe showing the locatoin of the T-HRECS DL (EC.T Datalogger) can be seen on on the right (river-left). The flows range from 2-75 cms here throughout the year and given the long canyon, required 400g/cms to measure accurately. This means that for the 40cms measurement, 16kg was required, or 80 litres of brine at 20%. This requires careful management of the brine, which does not last very long for large flow events. We installed a secondary tank connected by a hose, as well as an upstream EC.T meter to better track the BG EC.T during an SDIQ in July 2022. This system also has a Neon satellite telemetry unit, and two EC.T probes measuring pumped brine conductivity and temperature.


There has been 92 measurements at this site so far, but the hydraulic control changes frequently. So far we are working with 3 rating curves since March 2022. This has been a challenging site, but the AutoSalt has performed well.
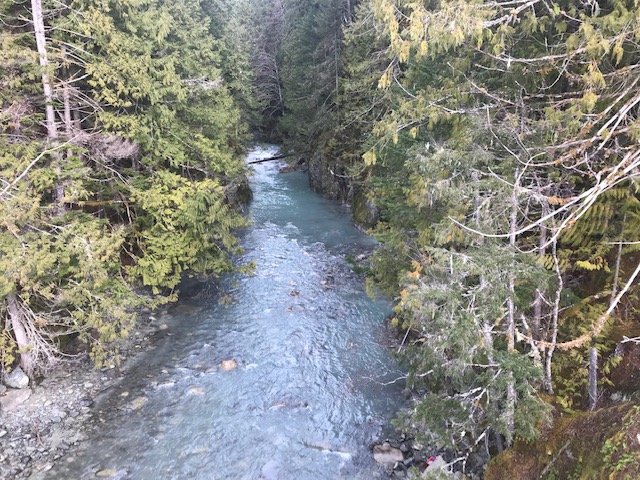
Krokbräcke Creek near Fjällbacka, Sweden (May 2022)


This lovely little stream features very large pools compared to the flow when we installed this in May. We installed three downstream EC.T probes at intervals of ~100m to capture a range of flow events.

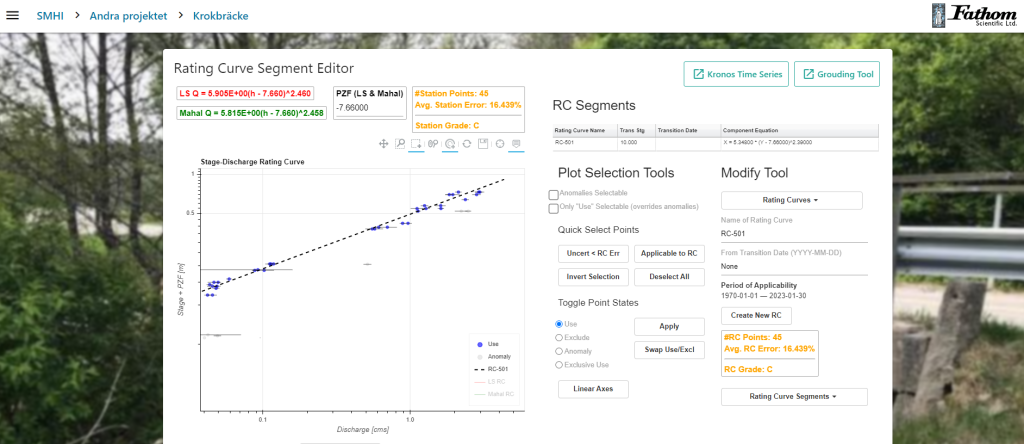
Krockbracke Update! A storm came through Fjällbacka on Nov 7, 2022 and we were able to measure up to 2-3cms, although there is evidence of either a) incomplete mixing or b) fouled sensors. This rating curve has had a few outliers labeled anomalous.

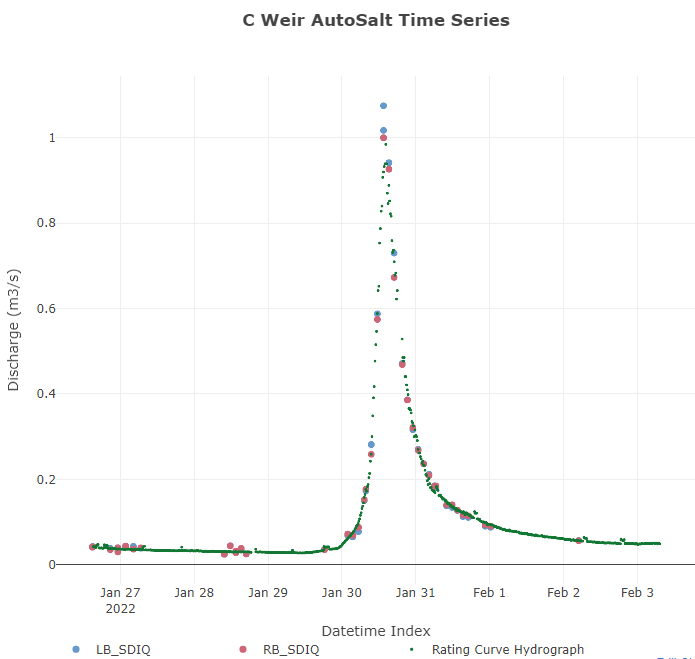
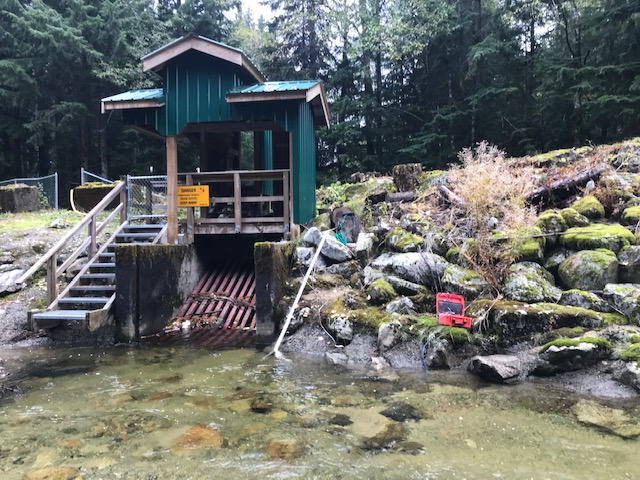
Carnation Creek Weir C for BCMoE near Port Renfrew BC, Canada (2022)


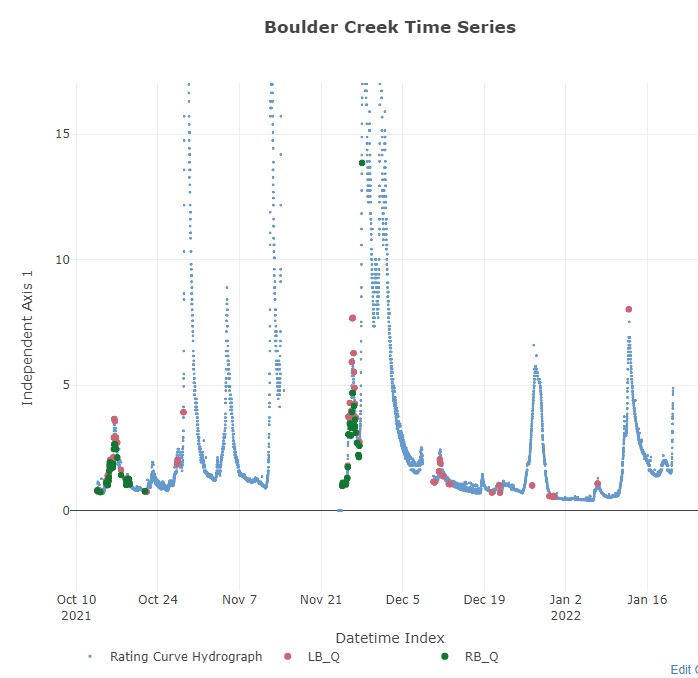
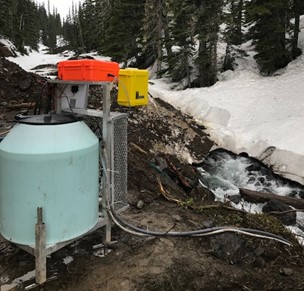
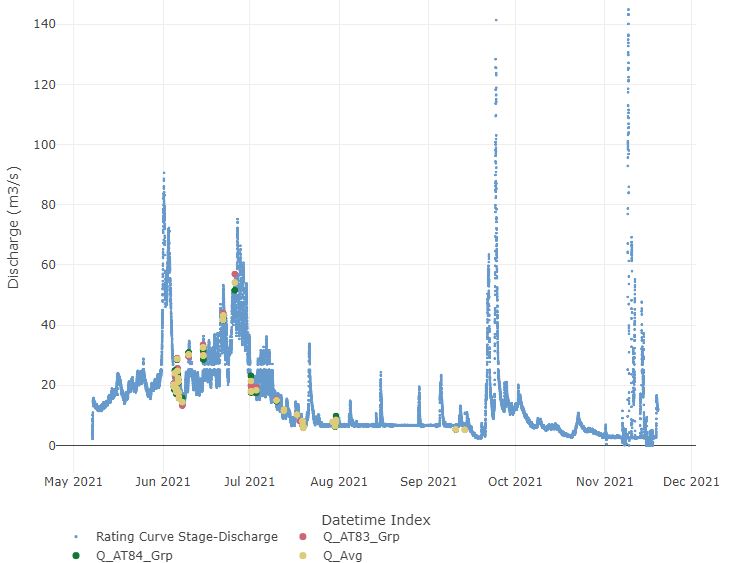
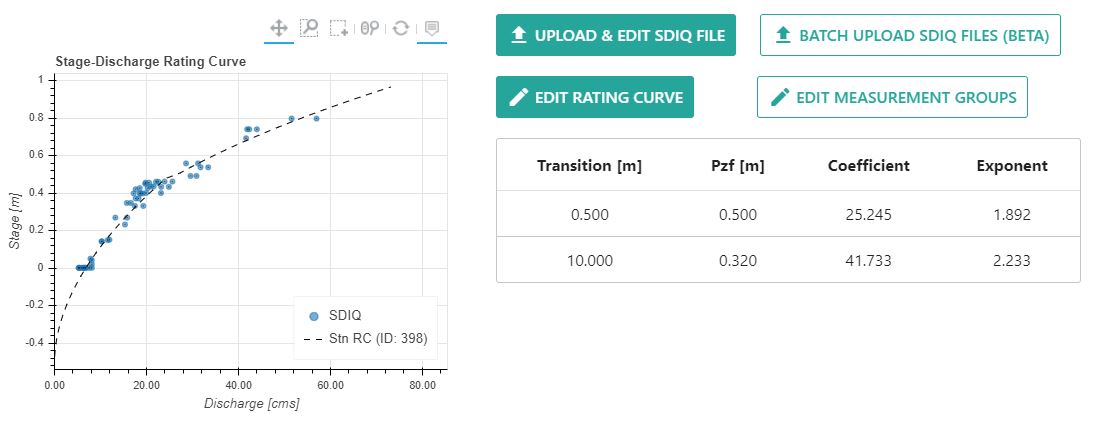
Boulder Creek, BC Hydro, Near Jones Lake, B.C. 2021


Nooklikonnik Creek for Nuxalk First Nation near Bella Coola, BC, Canada (2021)


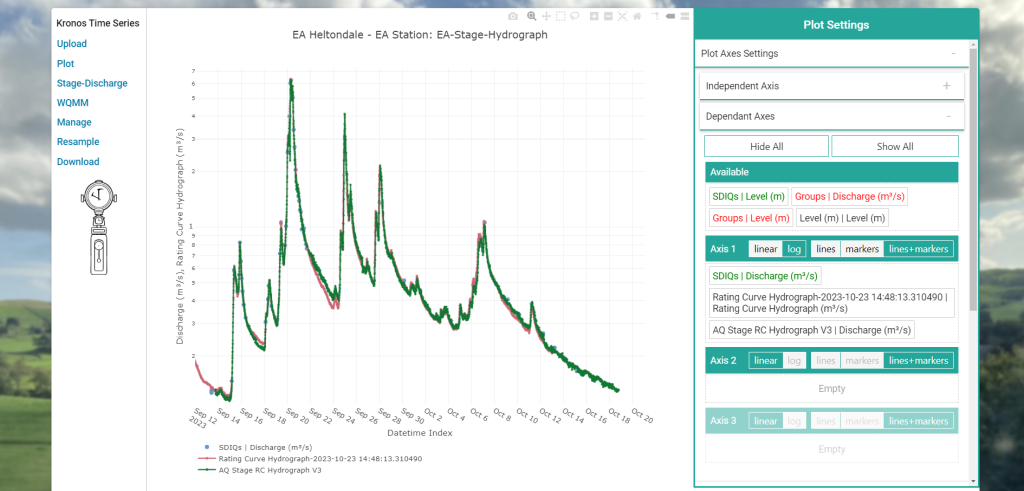
Introducing… Kronos Time Series! This is the first image of the AutoSalt stage, converted to a hydrograph using the Rating Curve -> Discharge tool for multiple, compound Rating Curves. Interactive! Powerful! Fun!
Eskay Creek in Northern BC, Canada (2021)


Stawamus River for WSC Highway 99 (08GA076)


Martelltal in the Autonomous Province of South Tyrol, Italy (2020) for the TUM


Downstream Right Bank Gauge site and Conductivity probe.
Finstertal in North Tirol, Austria (2020) for TUM
[rev_slider alias=”hs-finstertal”]
Michael is the head of Health & Safety and here’s he’s demonstrating the effect of a high voltage electric fence.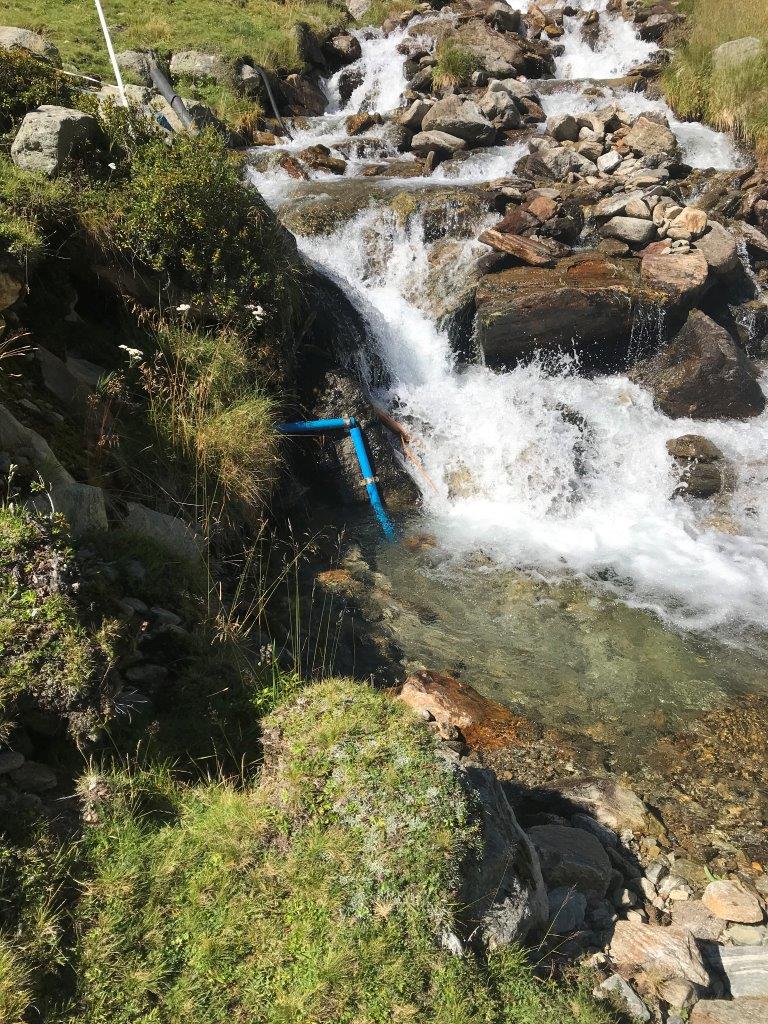
Creek PT and injection site
Downstream mixing reach.
MacKay Creek at Montroyal Boulevard (08GA061), North Vancouver, B.C. Canada (2020) for WSC


Harvey Creek at Lion’s Bay, B.C. Canada (2019) for UBC

Dr. Steven Weijs Happy with his new AutoSalt system with LTE Modem capability, then slowly realizing he has been replaced by a stick.
Harvey Creek RC Sep 17, 2020
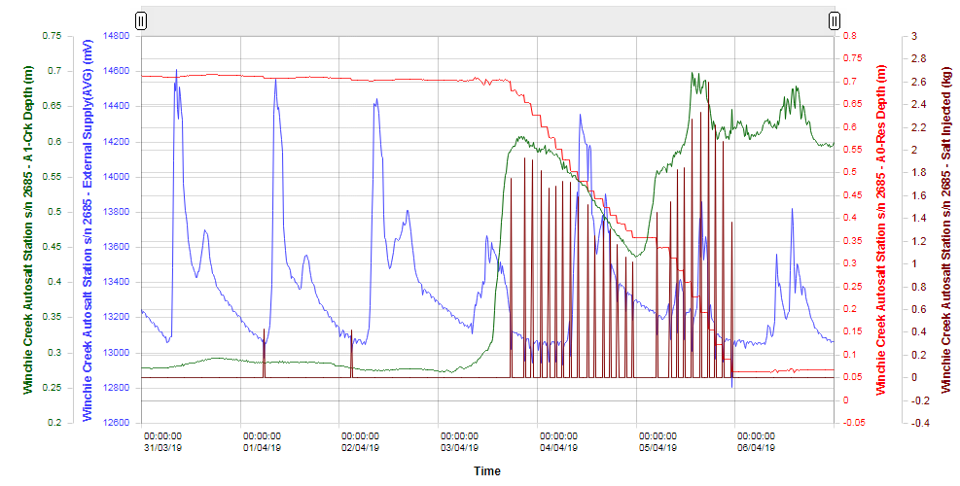
Winchie Creek near Tofino, B.C. Canada (2019) for Barkley Project Group
Winchie Creek Injection site looking downstream. The injection system injects into the tailrace flow, which then mixes with the mainstem flow and the T-HRECS are installed further downstream to measure the total flow in the Mainstem+Tailrace


Lowhee Creek near Barkerville, B.C. Canada for Barkerville Gold Mine


Horizons Regional Council installation at Kumeti Teruhunga, New Zealand (2018)


NIWA Rollergate Station, New Zealand (2018)


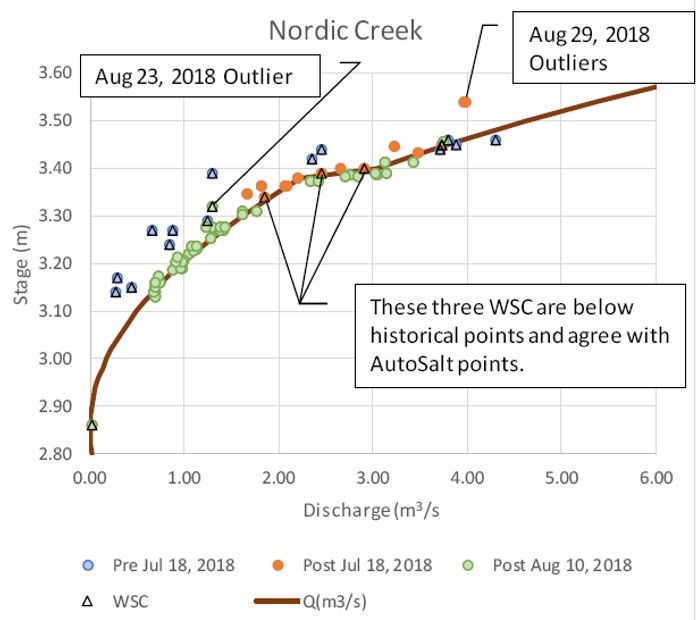
WSC Nordic Creek at the Outlet of Nordic Glacier (08NB020) near Golden B.C. Canada (2018)


University of Saskatchewan Peyto Glacier, near Canmore, AB, Canada (2018)


Culliton Creek Injection Station, near Squamish B.C. Canada (2016)


Culliton Creek showing RC prior to installation of AutoSalt (ARDRC005.1) and after (ARDRC006)
Wedge Creek near Whistler, B.C. Canada (2016)